29
/
en
AIzaSyAYiBZKx7MnpbEhh9jyipgxe19OcubqV5w
April 1, 2024
138771
Georgia
GEO
true
2
1
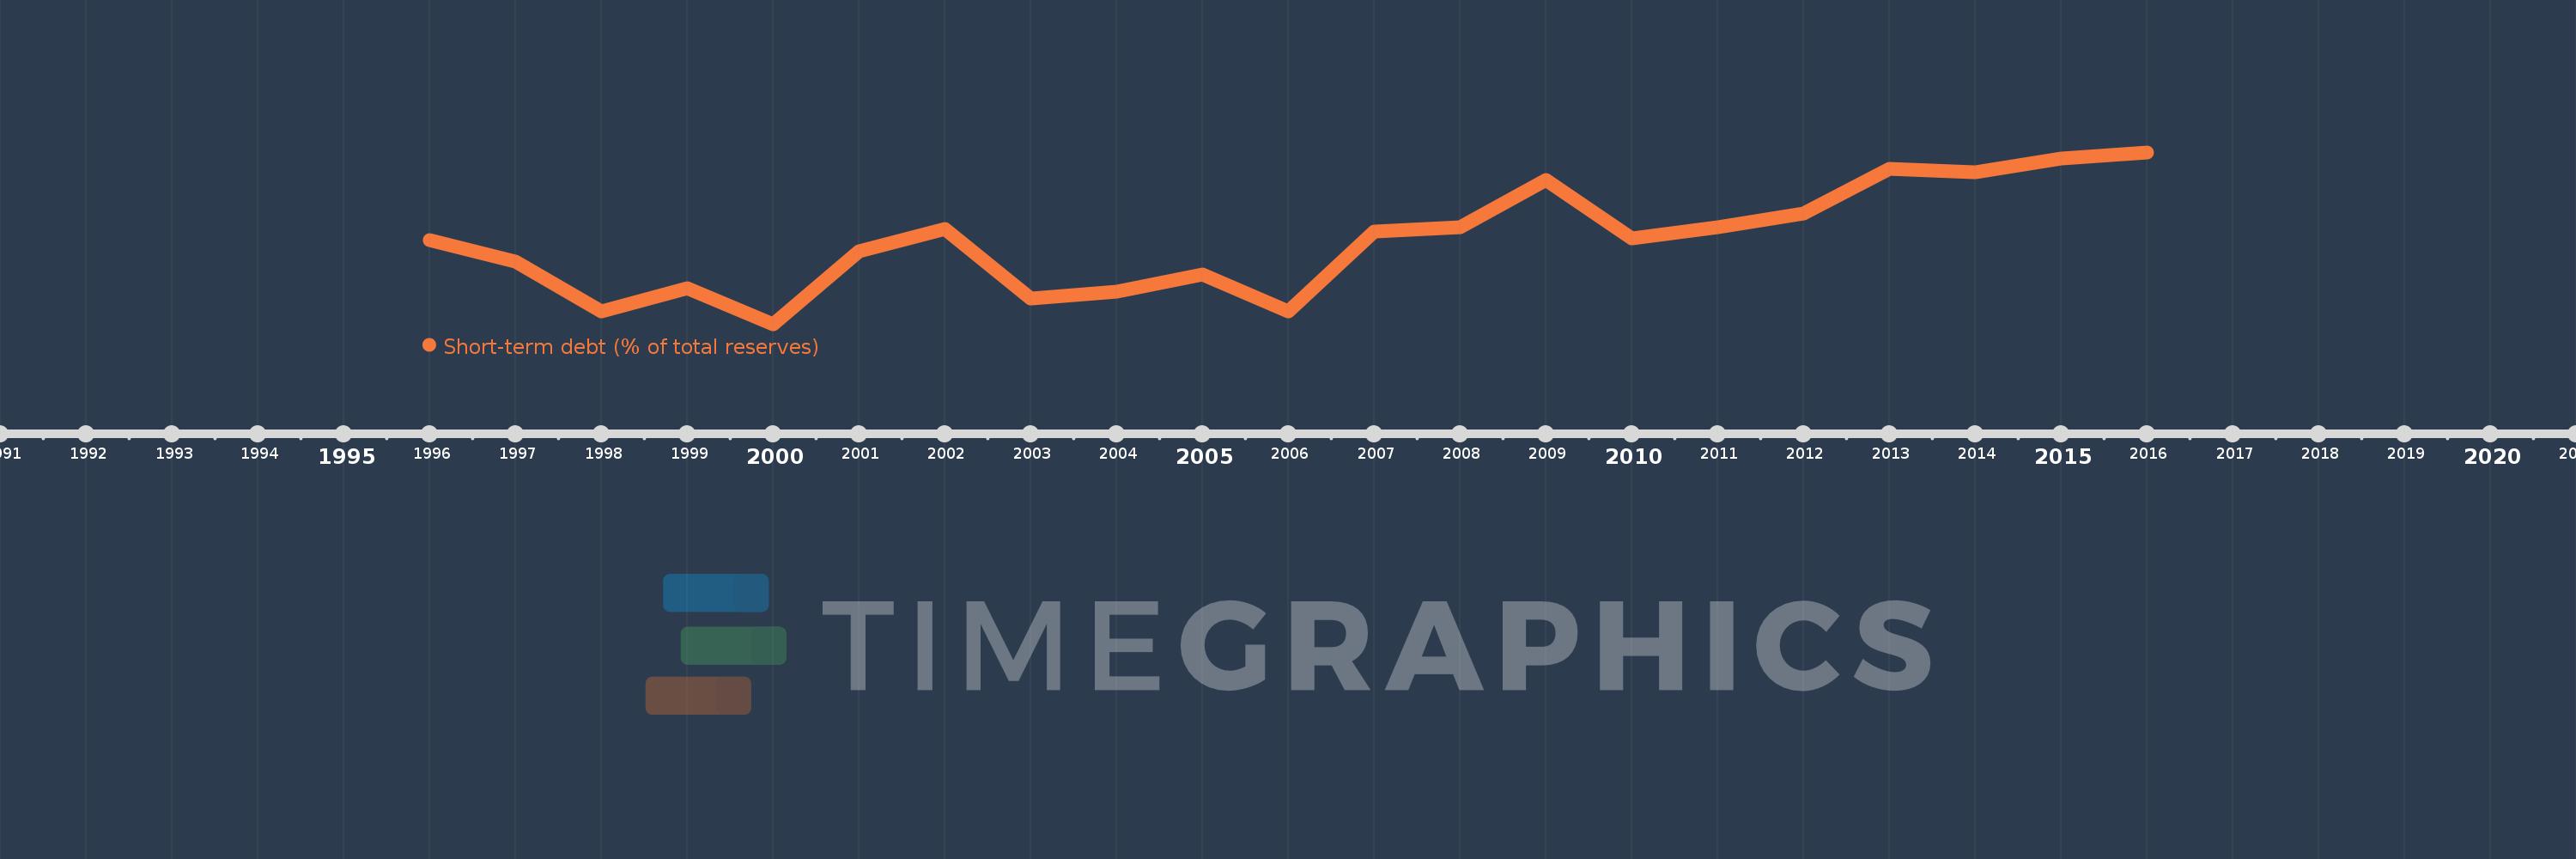
Short-term debt (% of total reserves)
2016,2015,2014,2013,2012,2011,2010,2009,2008,2007,2006,2005,2004,2003,2002,2001,2000,1999,1998,1997,1996
This statistics in other country:
Timeline:
This timeline shows a graph from 1996 to 2016 of Georgia. No data until 1995. Number of actual observations by date: 21.
Source name:
World Development Indicators
Source organization:
World Bank, International Debt Statistics.
Categories, topics:
Economy & Growth, External Debt
Last updated:
apr 23, 2017
Indicators value changes by year
Maximum:
82.502
jan 1, 2016
At the date of observation
Value
Absolute change
Change from previous value
jan 1, 1996
43.045
+43.045
0.0%
jan 1, 1997
33.192
-9.854
-22.89%
jan 1, 1998
10.717
-22.475
-67.71%
jan 1, 1999
21.215
+10.498
97.96%
jan 1, 2000
4.847
-16.368
-77.15%
jan 1, 2001
37.725
+32.877
678.24%
jan 1, 2002
47.983
+10.258
27.19%
jan 1, 2003
16.388
-31.595
-65.85%
jan 1, 2004
19.411
+3.023
18.45%
jan 1, 2005
27.482
+8.071
41.58%
jan 1, 2006
10.524
-16.958
-61.7%
jan 1, 2007
46.809
+36.285
344.78%
jan 1, 2008
48.757
+1.947
4.16%
jan 1, 2009
70.027
+21.27
43.62%
jan 1, 2010
43.81
-26.217
-37.44%
jan 1, 2011
48.622
+4.812
10.98%
jan 1, 2012
54.85
+6.228
12.81%
jan 1, 2013
75.146
+20.296
37.0%
jan 1, 2014
73.695
-1.45
-1.93%
jan 1, 2015
79.673
+5.978
8.11%
jan 1, 2016
82.502
+2.829
3.55%
Ranking of countries by current statistics by years


Comments: