29
/
en
AIzaSyAYiBZKx7MnpbEhh9jyipgxe19OcubqV5w
April 1, 2024
263003
Thailand
THA
true
2
1
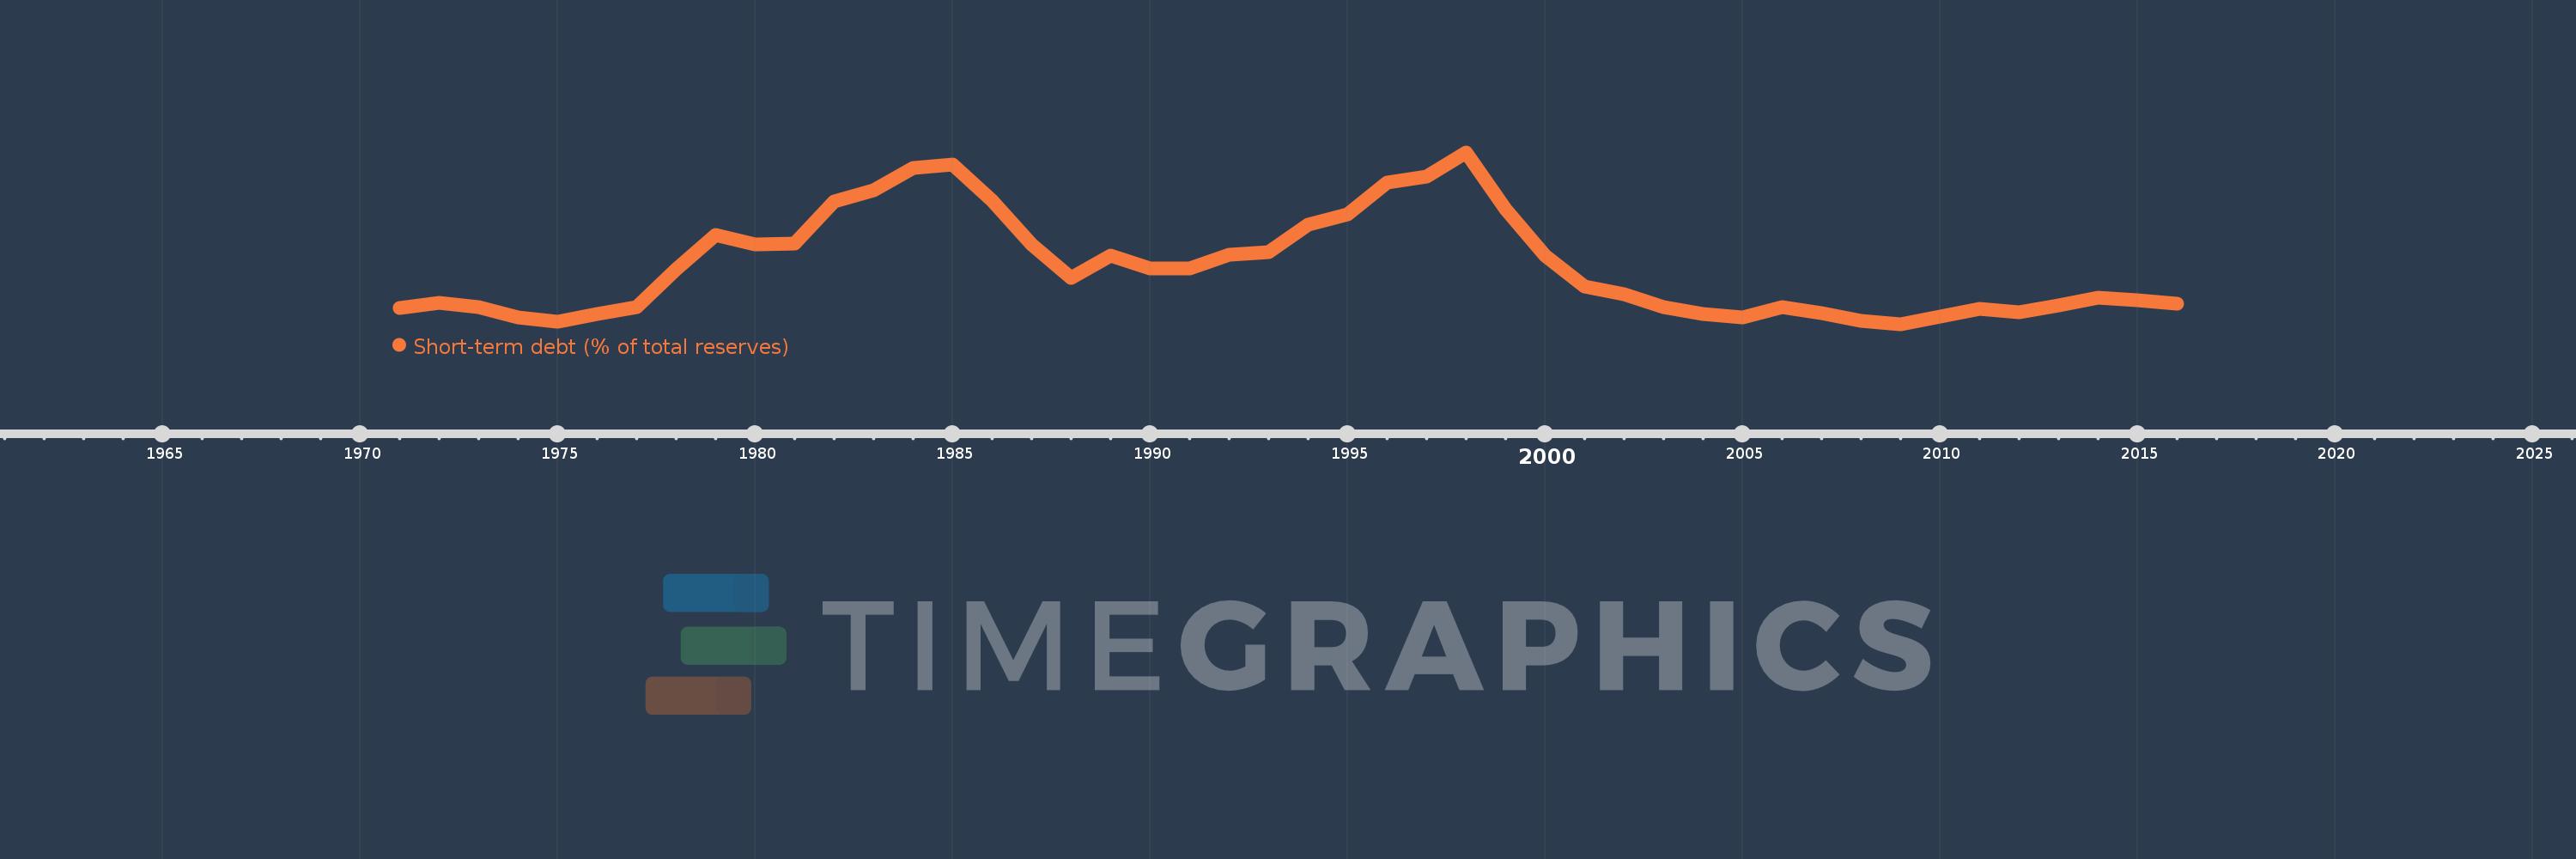
Short-term debt (% of total reserves)
2016,2015,2014,2013,2012,2011,2010,2009,2008,2007,2006,2005,2004,2003,2002,2001,2000,1999,1998,1997,1996,1995,1994,1993,1992,1991,1990,1989,1988,1987,1986,1985,1984,1983,1982,1981,1980,1979,1978,1977,1976,1975,1974,1973,1972,1971
This statistics in other country:
Timeline:
This timeline shows a graph from 1971 to 2016 of Thailand. No data until 1970. Number of actual observations by date: 46.
Source name:
World Development Indicators
Source organization:
World Bank, International Debt Statistics.
Categories, topics:
Economy & Growth, External Debt
Last updated:
apr 23, 2017
Indicators value changes by year
Minimum:
18.427
jan 1, 2009
Maximum:
140.668
jan 1, 1998
At the date of observation
Value
Absolute change
Change from previous value
jan 1, 1971
30.185
+30.185
0.0%
jan 1, 1972
33.369
+3.183
10.55%
jan 1, 1973
30.308
-3.061
-9.17%
jan 1, 1974
23.341
-6.966
-22.99%
jan 1, 1975
20.049
-3.292
-14.1%
jan 1, 1976
25.561
+5.511
27.49%
jan 1, 1977
30.291
+4.73
18.51%
jan 1, 1978
57.243
+26.953
88.98%
jan 1, 1979
81.896
+24.653
43.07%
jan 1, 1980
75.489
-6.407
-7.82%
jan 1, 1981
76.1
+0.612
0.81%
jan 1, 1982
105.793
+29.693
39.02%
jan 1, 1983
113.73
+7.937
7.5%
jan 1, 1984
129.311
+15.58
13.7%
jan 1, 1985
132.139
+2.828
2.19%
jan 1, 1986
106.549
-25.591
-19.37%
jan 1, 1987
75.201
-31.347
-29.42%
jan 1, 1988
51.175
-24.027
-31.95%
jan 1, 1989
67.488
+16.314
31.88%
jan 1, 1990
58.164
-9.324
-13.82%
jan 1, 1991
58.369
+0.205
0.35%
jan 1, 1992
67.919
+9.551
16.36%
jan 1, 1993
69.522
+1.603
2.36%
jan 1, 1994
88.973
+19.451
27.98%
jan 1, 1995
96.362
+7.389
8.3%
jan 1, 1996
119.373
+23.011
23.88%
jan 1, 1997
123.471
+4.098
3.43%
jan 1, 1998
140.668
+17.196
13.93%
jan 1, 1999
100.416
-40.252
-28.61%
jan 1, 2000
67.33
-33.086
-32.95%
jan 1, 2001
45.553
-21.777
-32.34%
jan 1, 2002
40.021
-5.532
-12.14%
jan 1, 2003
30.637
-9.383
-23.45%
jan 1, 2004
25.986
-4.652
-15.18%
jan 1, 2005
23.047
-2.939
-11.31%
jan 1, 2006
30.751
+7.705
33.43%
jan 1, 2007
26.582
-4.169
-13.56%
jan 1, 2008
20.915
-5.667
-21.32%
jan 1, 2009
18.427
-2.488
-11.9%
jan 1, 2010
24.046
+5.619
30.5%
jan 1, 2011
29.447
+5.401
22.46%
jan 1, 2012
27.039
-2.408
-8.18%
jan 1, 2013
32.059
+5.02
18.57%
jan 1, 2014
37.013
+4.954
15.45%
jan 1, 2015
35.686
-1.327
-3.58%
jan 1, 2016
32.759
-2.926
-8.2%
Ranking of countries by current statistics by years


Comments: