29
/
en
AIzaSyAYiBZKx7MnpbEhh9jyipgxe19OcubqV5w
April 1, 2024
58552
South Asia (IDA & IBRD)
TSA
false
2
1
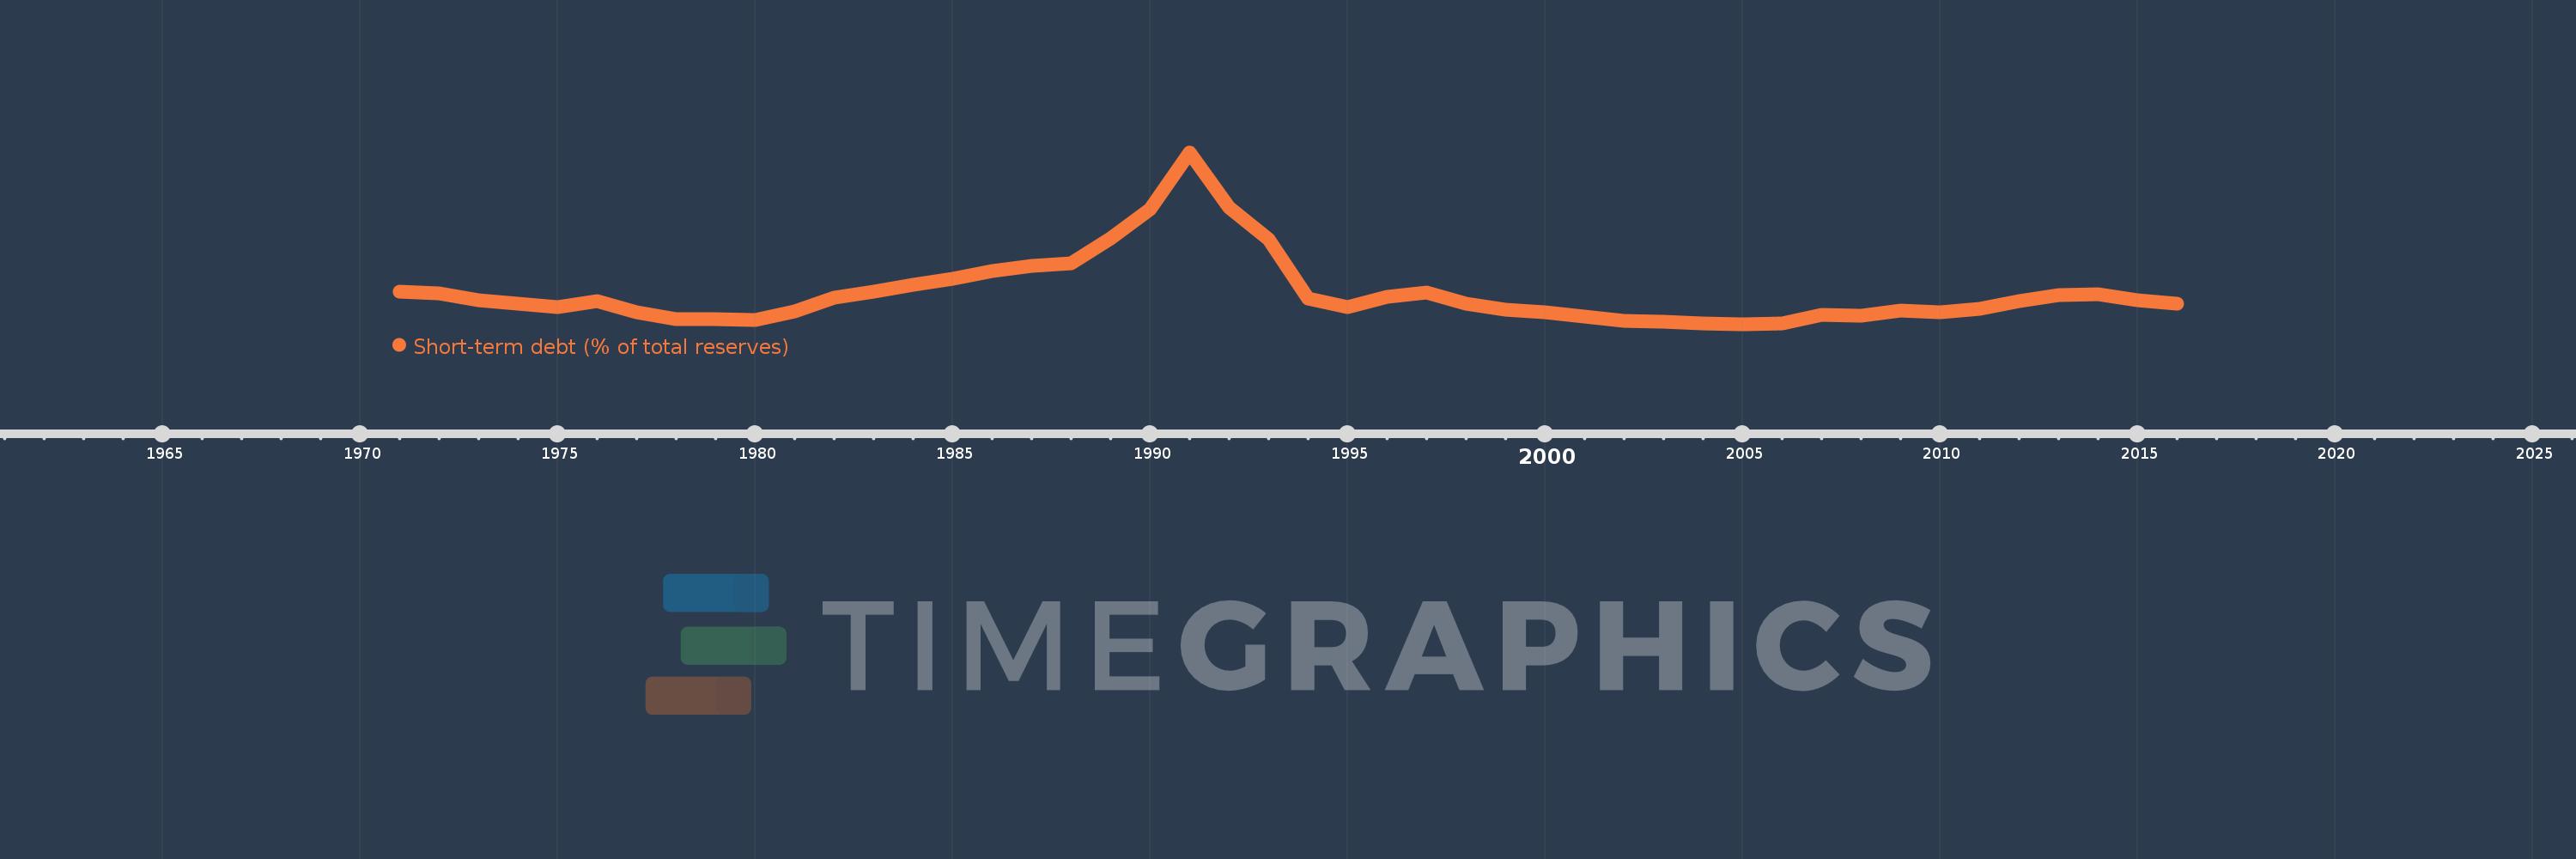
Short-term debt (% of total reserves)
2016,2015,2014,2013,2012,2011,2010,2009,2008,2007,2006,2005,2004,2003,2002,2001,2000,1999,1998,1997,1996,1995,1994,1993,1992,1991,1990,1989,1988,1987,1986,1985,1984,1983,1982,1981,1980,1979,1978,1977,1976,1975,1974,1973,1972,1971
This statistics in other country:
Timeline:
This timeline shows a graph from 1971 to 2016 of South Asia (IDA & IBRD). No data until 1970. Number of actual observations by date: 46.
Source name:
World Development Indicators
Source organization:
World Bank, International Debt Statistics.
Categories, topics:
Economy & Growth, External Debt
Last updated:
apr 23, 2017
Indicators value changes by year
Maximum:
149.326
jan 1, 1991
At the date of observation
Value
Absolute change
Change from previous value
jan 1, 1971
33.718
+33.718
0.0%
jan 1, 1972
32.521
-1.197
-3.55%
jan 1, 1973
26.223
-6.299
-19.37%
jan 1, 1974
23.702
-2.521
-9.61%
jan 1, 1975
20.783
-2.919
-12.32%
jan 1, 1976
25.873
+5.091
24.5%
jan 1, 1977
16.776
-9.098
-35.16%
jan 1, 1978
10.779
-5.997
-35.75%
jan 1, 1979
10.624
-0.155
-1.44%
jan 1, 1980
9.918
-0.706
-6.65%
jan 1, 1981
16.923
+7.006
70.64%
jan 1, 1982
28.589
+11.666
68.94%
jan 1, 1983
33.553
+4.963
17.36%
jan 1, 1984
39.275
+5.722
17.05%
jan 1, 1985
44.47
+5.195
13.23%
jan 1, 1986
50.918
+6.448
14.5%
jan 1, 1987
55.124
+4.206
8.26%
jan 1, 1988
57.524
+2.4
4.35%
jan 1, 1989
78.123
+20.599
35.81%
jan 1, 1990
102.242
+24.119
30.87%
jan 1, 1991
149.326
+47.084
46.05%
jan 1, 1992
103.657
-45.669
-30.58%
jan 1, 1993
77.283
-26.375
-25.44%
jan 1, 1994
27.862
-49.421
-63.95%
jan 1, 1995
20.534
-7.328
-26.3%
jan 1, 1996
29.458
+8.924
43.46%
jan 1, 1997
33.269
+3.811
12.94%
jan 1, 1998
23.6
-9.669
-29.06%
jan 1, 1999
18.992
-4.608
-19.53%
jan 1, 2000
16.424
-2.567
-13.52%
jan 1, 2001
12.807
-3.617
-22.02%
jan 1, 2002
9.149
-3.658
-28.56%
jan 1, 2003
8.475
-0.674
-7.37%
jan 1, 2004
7.39
-1.085
-12.8%
jan 1, 2005
6.618
-0.773
-10.46%
jan 1, 2006
7.416
+0.799
12.07%
jan 1, 2007
14.217
+6.801
91.7%
jan 1, 2008
13.554
-0.663
-4.66%
jan 1, 2009
17.898
+4.344
32.05%
jan 1, 2010
16.829
-1.069
-5.97%
jan 1, 2011
19.229
+2.4
14.26%
jan 1, 2012
25.688
+6.459
33.59%
jan 1, 2013
30.586
+4.898
19.07%
jan 1, 2014
31.624
+1.038
3.39%
jan 1, 2015
26.8
-4.824
-15.26%
jan 1, 2016
23.683
-3.116
-11.63%
Ranking of countries by current statistics by years


Comments: