29
/
en
AIzaSyAYiBZKx7MnpbEhh9jyipgxe19OcubqV5w
April 1, 2024
156741
Indonesia
IDN
true
2
1
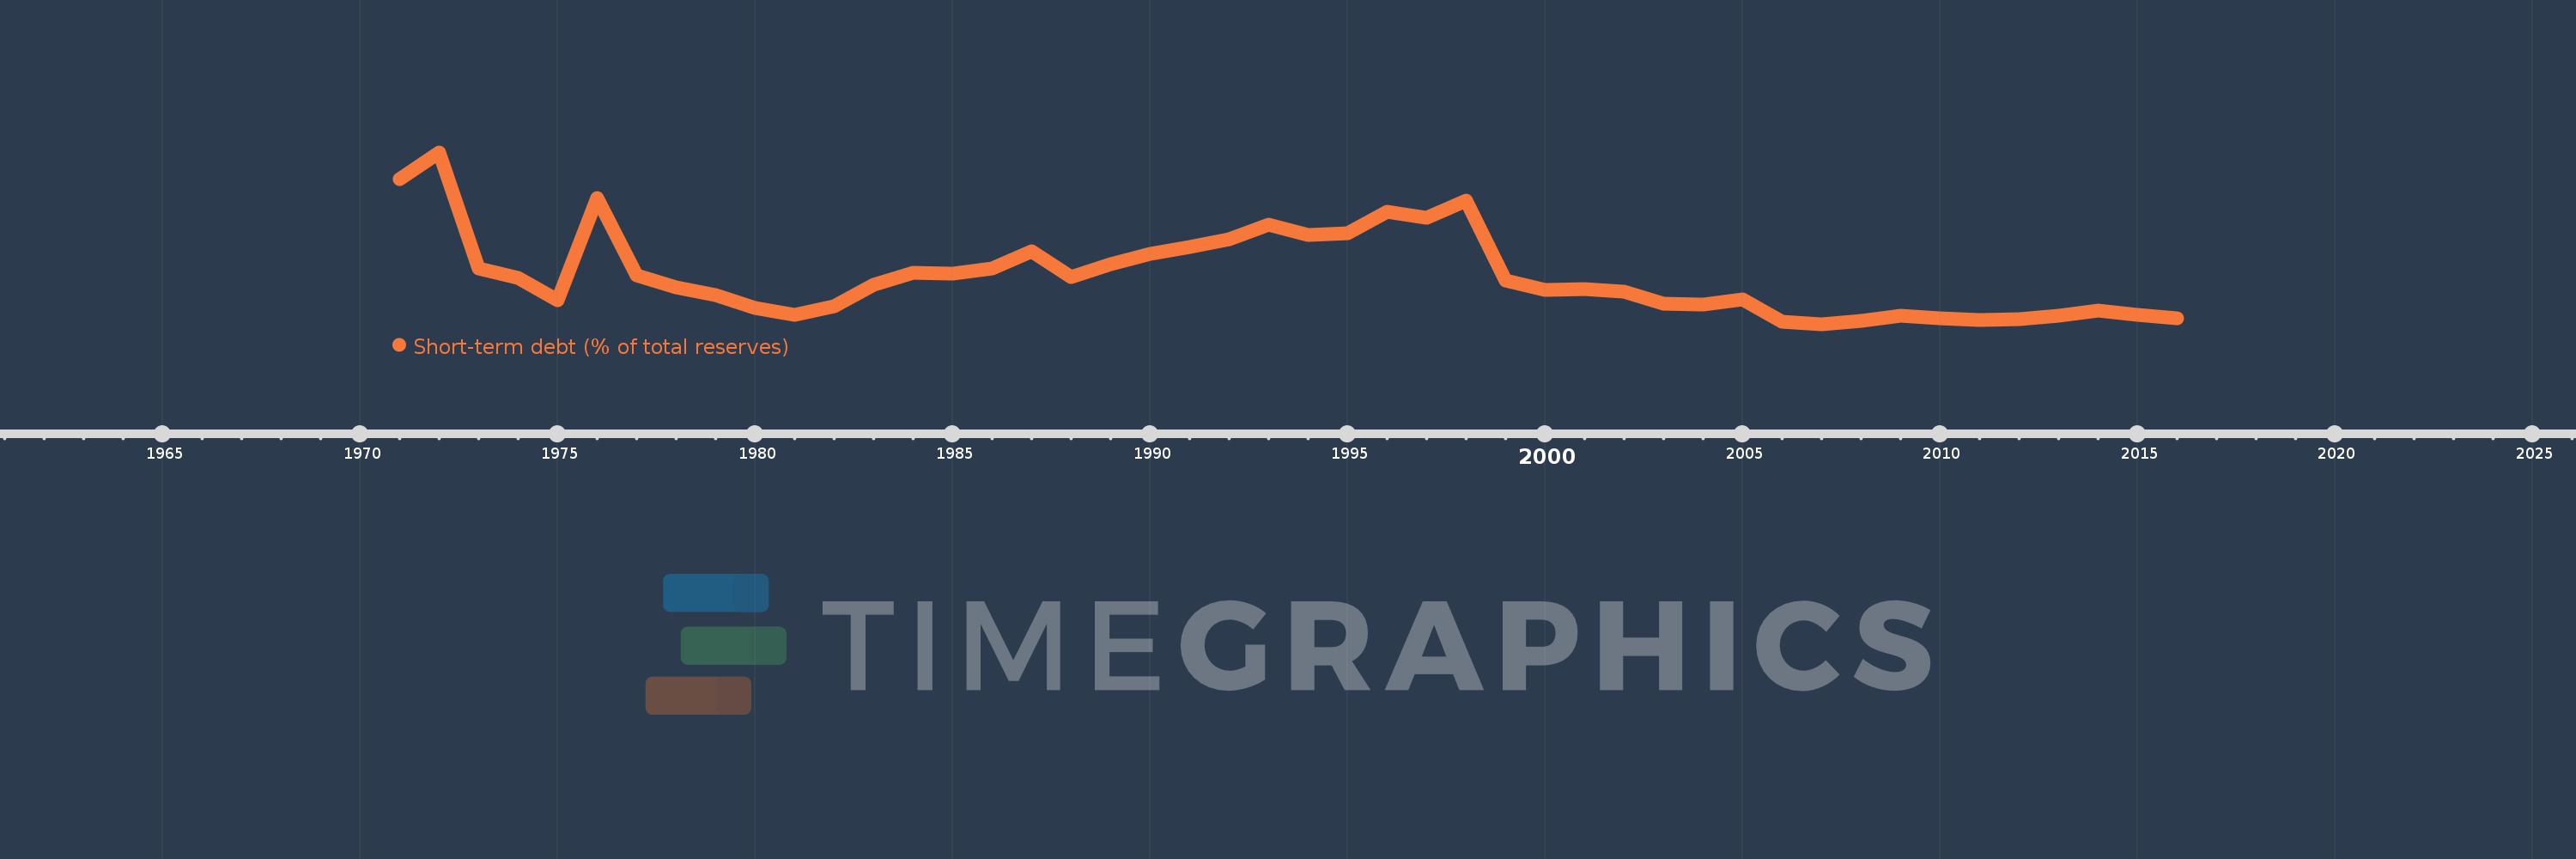
Short-term debt (% of total reserves)
2016,2015,2014,2013,2012,2011,2010,2009,2008,2007,2006,2005,2004,2003,2002,2001,2000,1999,1998,1997,1996,1995,1994,1993,1992,1991,1990,1989,1988,1987,1986,1985,1984,1983,1982,1981,1980,1979,1978,1977,1976,1975,1974,1973,1972,1971
This statistics in other country:
Timeline:
This timeline shows a graph from 1971 to 2016 of Indonesia. No data until 1970. Number of actual observations by date: 46.
Source name:
World Development Indicators
Source organization:
World Bank, International Debt Statistics.
Categories, topics:
Economy & Growth, External Debt
Last updated:
apr 23, 2017
Indicators value changes by year
Maximum:
250.665
jan 1, 1972
At the date of observation
Value
Absolute change
Change from previous value
jan 1, 1971
216.146
+216.146
0.0%
jan 1, 1972
250.665
+34.519
15.97%
jan 1, 1973
100.304
-150.36
-59.98%
jan 1, 1974
88.518
-11.786
-11.75%
jan 1, 1975
59.928
-28.59
-32.3%
jan 1, 1976
191.617
+131.689
219.74%
jan 1, 1977
91.943
-99.674
-52.02%
jan 1, 1978
75.889
-16.054
-17.46%
jan 1, 1979
66.723
-9.166
-12.08%
jan 1, 1980
50.129
-16.594
-24.87%
jan 1, 1981
40.791
-9.338
-18.63%
jan 1, 1982
52.401
+11.61
28.46%
jan 1, 1983
79.252
+26.851
51.24%
jan 1, 1984
94.624
+15.372
19.4%
jan 1, 1985
94.381
-0.243
-0.26%
jan 1, 1986
100.998
+6.617
7.01%
jan 1, 1987
122.82
+21.822
21.61%
jan 1, 1988
89.645
-33.175
-27.01%
jan 1, 1989
106.411
+16.765
18.7%
jan 1, 1990
119.04
+12.629
11.87%
jan 1, 1991
128.631
+9.591
8.06%
jan 1, 1992
138.201
+9.57
7.44%
jan 1, 1993
157.264
+19.064
13.79%
jan 1, 1994
144.195
-13.069
-8.31%
jan 1, 1995
146.061
+1.866
1.29%
jan 1, 1996
174.182
+28.121
19.25%
jan 1, 1997
166.169
-8.013
-4.6%
jan 1, 1998
187.942
+21.773
13.1%
jan 1, 1999
85.202
-102.74
-54.67%
jan 1, 2000
73.246
-11.957
-14.03%
jan 1, 2001
73.887
+0.641
0.88%
jan 1, 2002
71.276
-2.612
-3.53%
jan 1, 2003
55.024
-16.252
-22.8%
jan 1, 2004
53.72
-1.304
-2.37%
jan 1, 2005
60.654
+6.934
12.91%
jan 1, 2006
31.737
-28.917
-47.68%
jan 1, 2007
28.66
-3.077
-9.7%
jan 1, 2008
32.766
+4.106
14.33%
jan 1, 2009
39.675
+6.909
21.09%
jan 1, 2010
36.373
-3.302
-8.32%
jan 1, 2011
34.349
-2.024
-5.57%
jan 1, 2012
34.66
+0.311
0.91%
jan 1, 2013
39.233
+4.573
13.19%
jan 1, 2014
46.395
+7.162
18.26%
jan 1, 2015
41.086
-5.309
-11.44%
jan 1, 2016
36.715
-4.371
-10.64%
Ranking of countries by current statistics by years


Comments: