29
/
en
AIzaSyAYiBZKx7MnpbEhh9jyipgxe19OcubqV5w
April 1, 2024
212394
Niger
NER
true
2
1
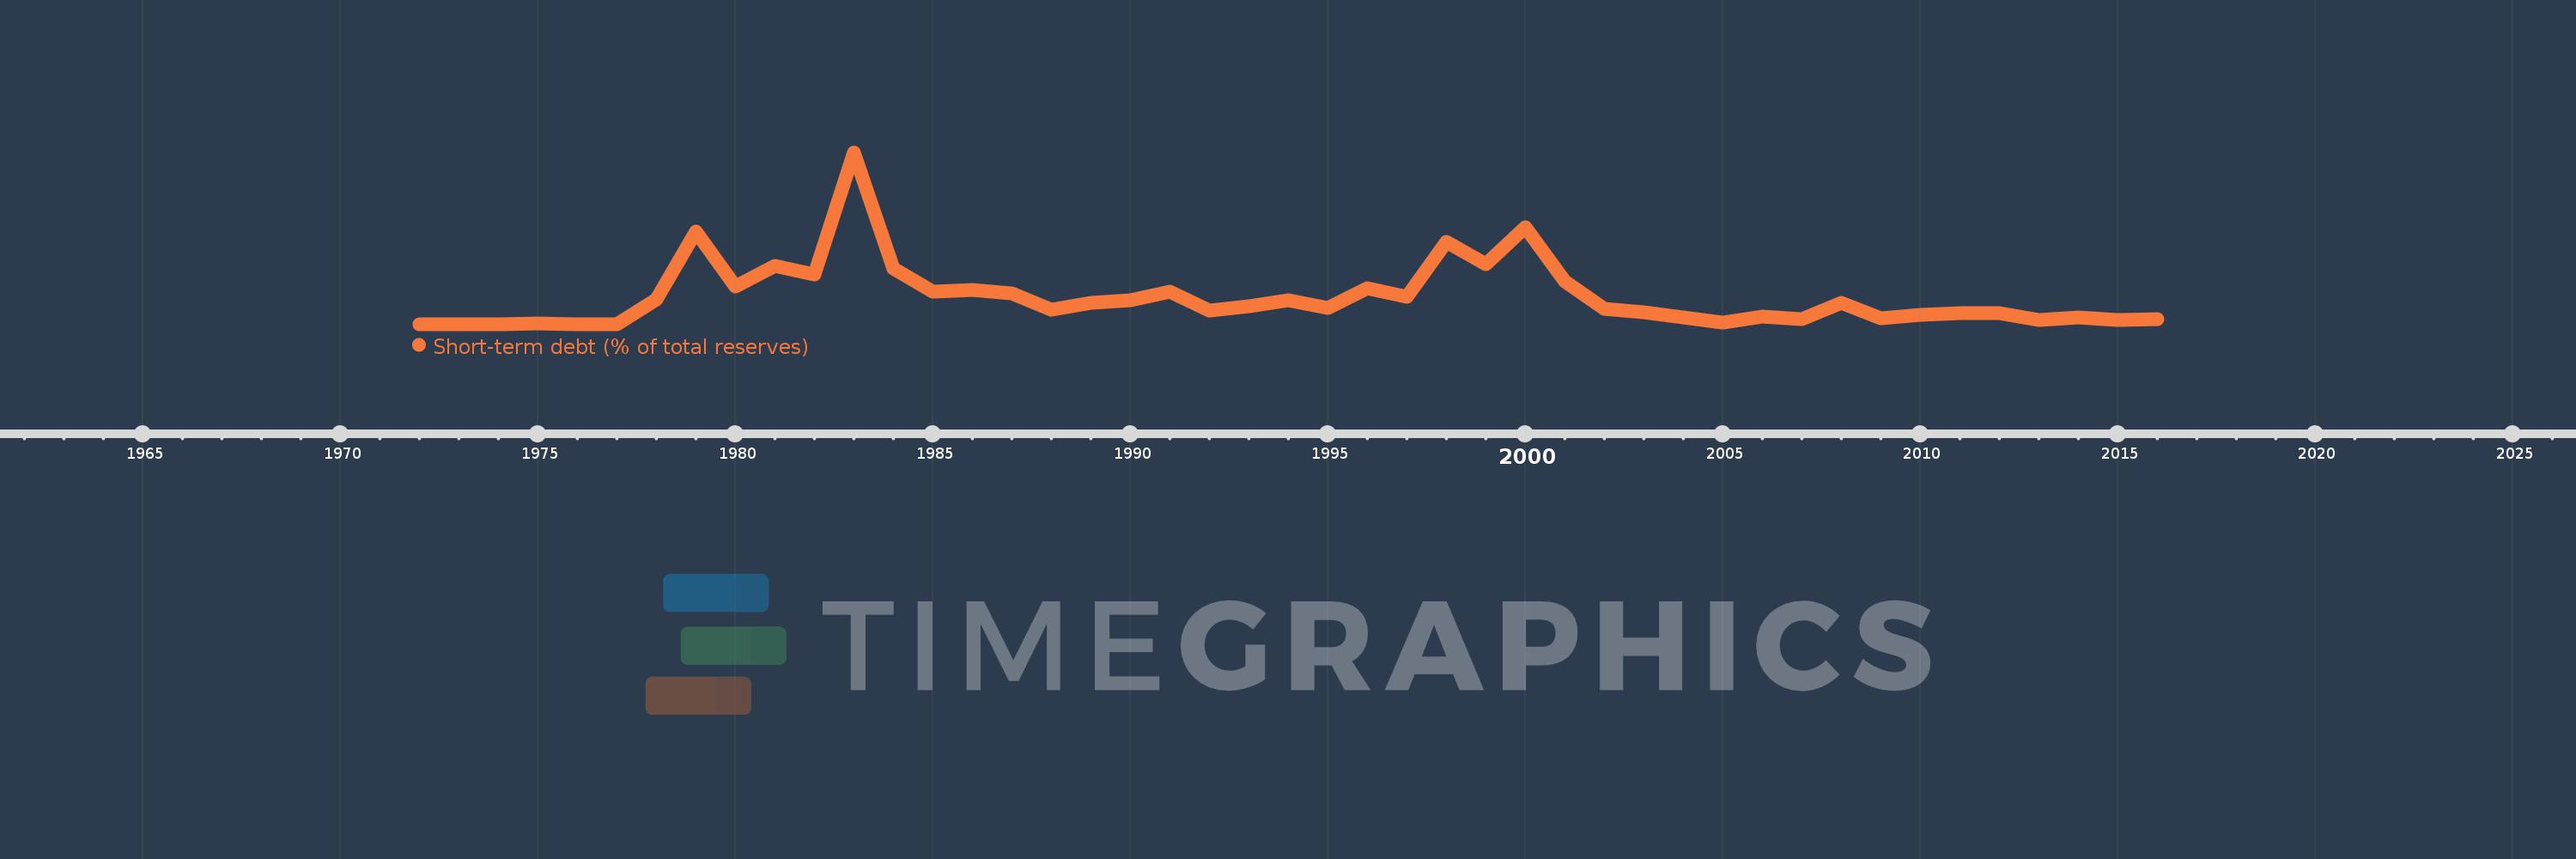
Short-term debt (% of total reserves)
2016,2015,2014,2013,2012,2011,2010,2009,2008,2007,2006,2005,2004,2003,2002,2001,2000,1999,1998,1997,1996,1995,1994,1993,1992,1991,1990,1989,1988,1987,1986,1985,1984,1983,1982,1981,1980,1979,1978,1977,1976,1975,1974,1973,1972
This statistics in other country:
Timeline:
This timeline shows a graph from 1972 to 2016 of Niger. No data until 1971. Number of actual observations by date: 45.
Source name:
World Development Indicators
Source organization:
World Bank, International Debt Statistics.
Categories, topics:
Economy & Growth, External Debt
Last updated:
apr 23, 2017
Indicators value changes by year
Maximum:
356.311
jan 1, 1983
At the date of observation
Value
Absolute change
Change from previous value
jan 1, 1972
0.06
+0.06
0.0%
jan 1, 1973
0.203
+0.144
241.17%
jan 1, 1974
0.402
+0.199
97.84%
jan 1, 1975
0.776
+0.374
93.05%
jan 1, 1976
0.672
-0.103
-13.33%
jan 1, 1977
0.755
+0.083
12.32%
jan 1, 1978
51.05
+50.295
6.66K%
jan 1, 1979
192.288
+141.238
276.67%
jan 1, 1980
77.399
-114.889
-59.75%
jan 1, 1981
120.254
+42.855
55.37%
jan 1, 1982
103.673
-16.581
-13.79%
jan 1, 1983
356.311
+252.638
243.69%
jan 1, 1984
115.251
-241.06
-67.65%
jan 1, 1985
68.157
-47.094
-40.86%
jan 1, 1986
70.616
+2.459
3.61%
jan 1, 1987
63.415
-7.201
-10.2%
jan 1, 1988
30.136
-33.279
-52.48%
jan 1, 1989
44.407
+14.271
47.36%
jan 1, 1990
49.356
+4.95
11.15%
jan 1, 1991
67.747
+18.391
37.26%
jan 1, 1992
28.096
-39.651
-58.53%
jan 1, 1993
36.918
+8.822
31.4%
jan 1, 1994
50.611
+13.693
37.09%
jan 1, 1995
33.975
-16.636
-32.87%
jan 1, 1996
74.811
+40.836
120.2%
jan 1, 1997
56.423
-18.388
-24.58%
jan 1, 1998
171.742
+115.319
204.38%
jan 1, 1999
124.218
-47.524
-27.67%
jan 1, 2000
200.769
+76.551
61.63%
jan 1, 2001
88.317
-112.452
-56.01%
jan 1, 2002
31.219
-57.099
-64.65%
jan 1, 2003
25.016
-6.203
-19.87%
jan 1, 2004
14.576
-10.44
-41.73%
jan 1, 2005
3.575
-11.001
-75.48%
jan 1, 2006
15.769
+12.195
341.15%
jan 1, 2007
10.32
-5.449
-34.56%
jan 1, 2008
44.068
+33.748
327.02%
jan 1, 2009
13.174
-30.893
-70.1%
jan 1, 2010
19.916
+6.741
51.17%
jan 1, 2011
22.675
+2.76
13.86%
jan 1, 2012
23.09
+0.415
1.83%
jan 1, 2013
9.667
-13.423
-58.13%
jan 1, 2014
14.17
+4.503
46.58%
jan 1, 2015
8.919
-5.251
-37.06%
jan 1, 2016
10.097
+1.177
13.2%
Ranking of countries by current statistics by years


Comments: