29
/
en
AIzaSyAYiBZKx7MnpbEhh9jyipgxe19OcubqV5w
April 1, 2024
234198
Sao Tome and Principe
STP
true
2
1
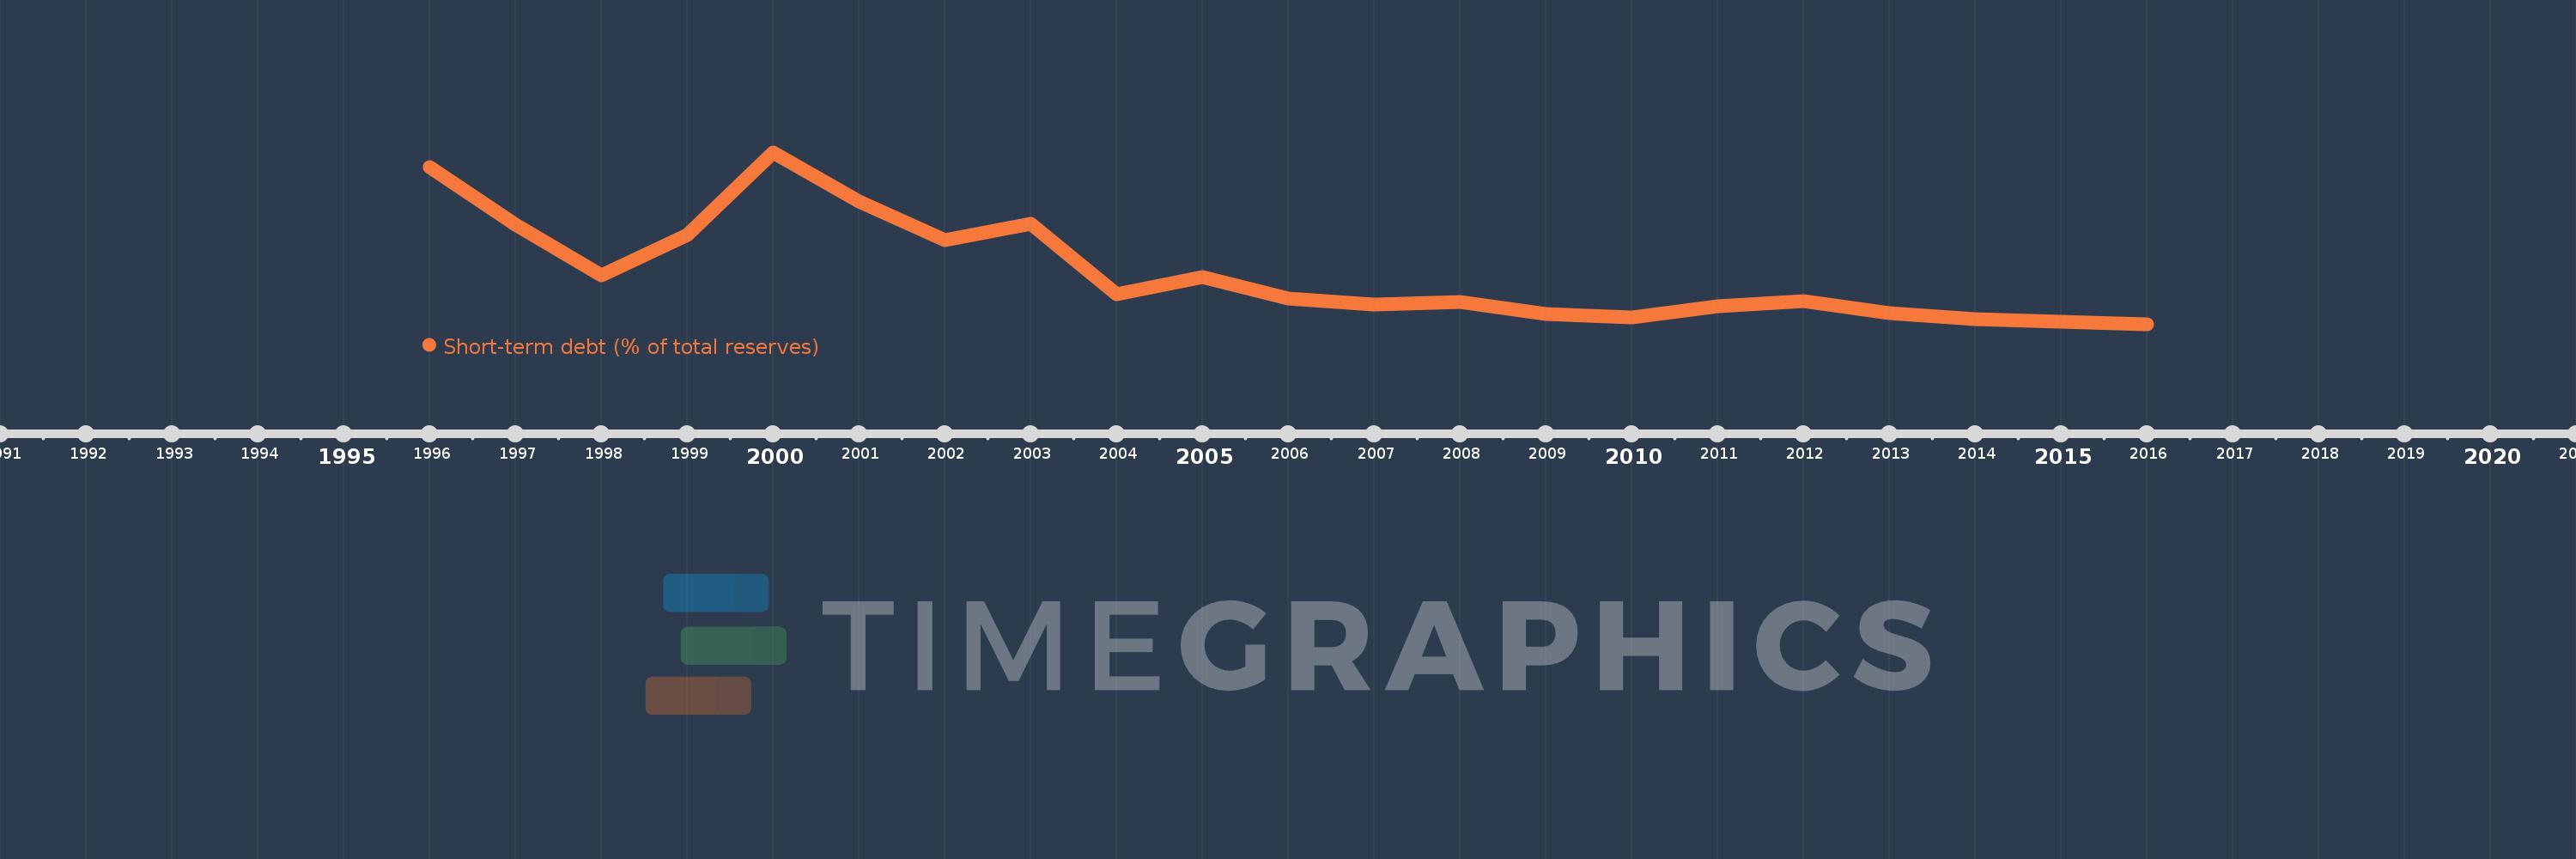
Short-term debt (% of total reserves)
2016,2015,2014,2013,2012,2011,2010,2009,2008,2007,2006,2005,2004,2003,2002,2001,2000,1999,1998,1997,1996
This statistics in other country:
Timeline:
This timeline shows a graph from 1996 to 2016 of Sao Tome and Principe. No data until 1995. Number of actual observations by date: 21.
Source name:
World Development Indicators
Source organization:
World Bank, International Debt Statistics.
Categories, topics:
Economy & Growth, External Debt
Last updated:
apr 23, 2017
Indicators value changes by year
Minimum:
14.533
jan 1, 2016
Maximum:
274.463
jan 1, 2000
At the date of observation
Value
Absolute change
Change from previous value
jan 1, 1996
252.721
+252.721
0.0%
jan 1, 1997
164.521
-88.2
-34.9%
jan 1, 1998
88.824
-75.697
-46.01%
jan 1, 1999
149.954
+61.13
68.82%
jan 1, 2000
274.463
+124.509
83.03%
jan 1, 2001
199.851
-74.612
-27.18%
jan 1, 2002
142.295
-57.556
-28.8%
jan 1, 2003
166.189
+23.894
16.79%
jan 1, 2004
60.412
-105.777
-63.65%
jan 1, 2005
85.77
+25.357
41.97%
jan 1, 2006
53.942
-31.827
-37.11%
jan 1, 2007
44.293
-9.649
-17.89%
jan 1, 2008
48.755
+4.462
10.07%
jan 1, 2009
29.733
-19.022
-39.02%
jan 1, 2010
24.672
-5.061
-17.02%
jan 1, 2011
41.341
+16.669
67.56%
jan 1, 2012
49.548
+8.207
19.85%
jan 1, 2013
30.85
-18.698
-37.74%
jan 1, 2014
22.05
-8.801
-28.53%
jan 1, 2015
18.228
-3.822
-17.33%
jan 1, 2016
14.533
-3.694
-20.27%
Ranking of countries by current statistics by years


Comments: