29
/
en
AIzaSyAYiBZKx7MnpbEhh9jyipgxe19OcubqV5w
April 1, 2024
268721
Tunisia
TUN
true
2
1
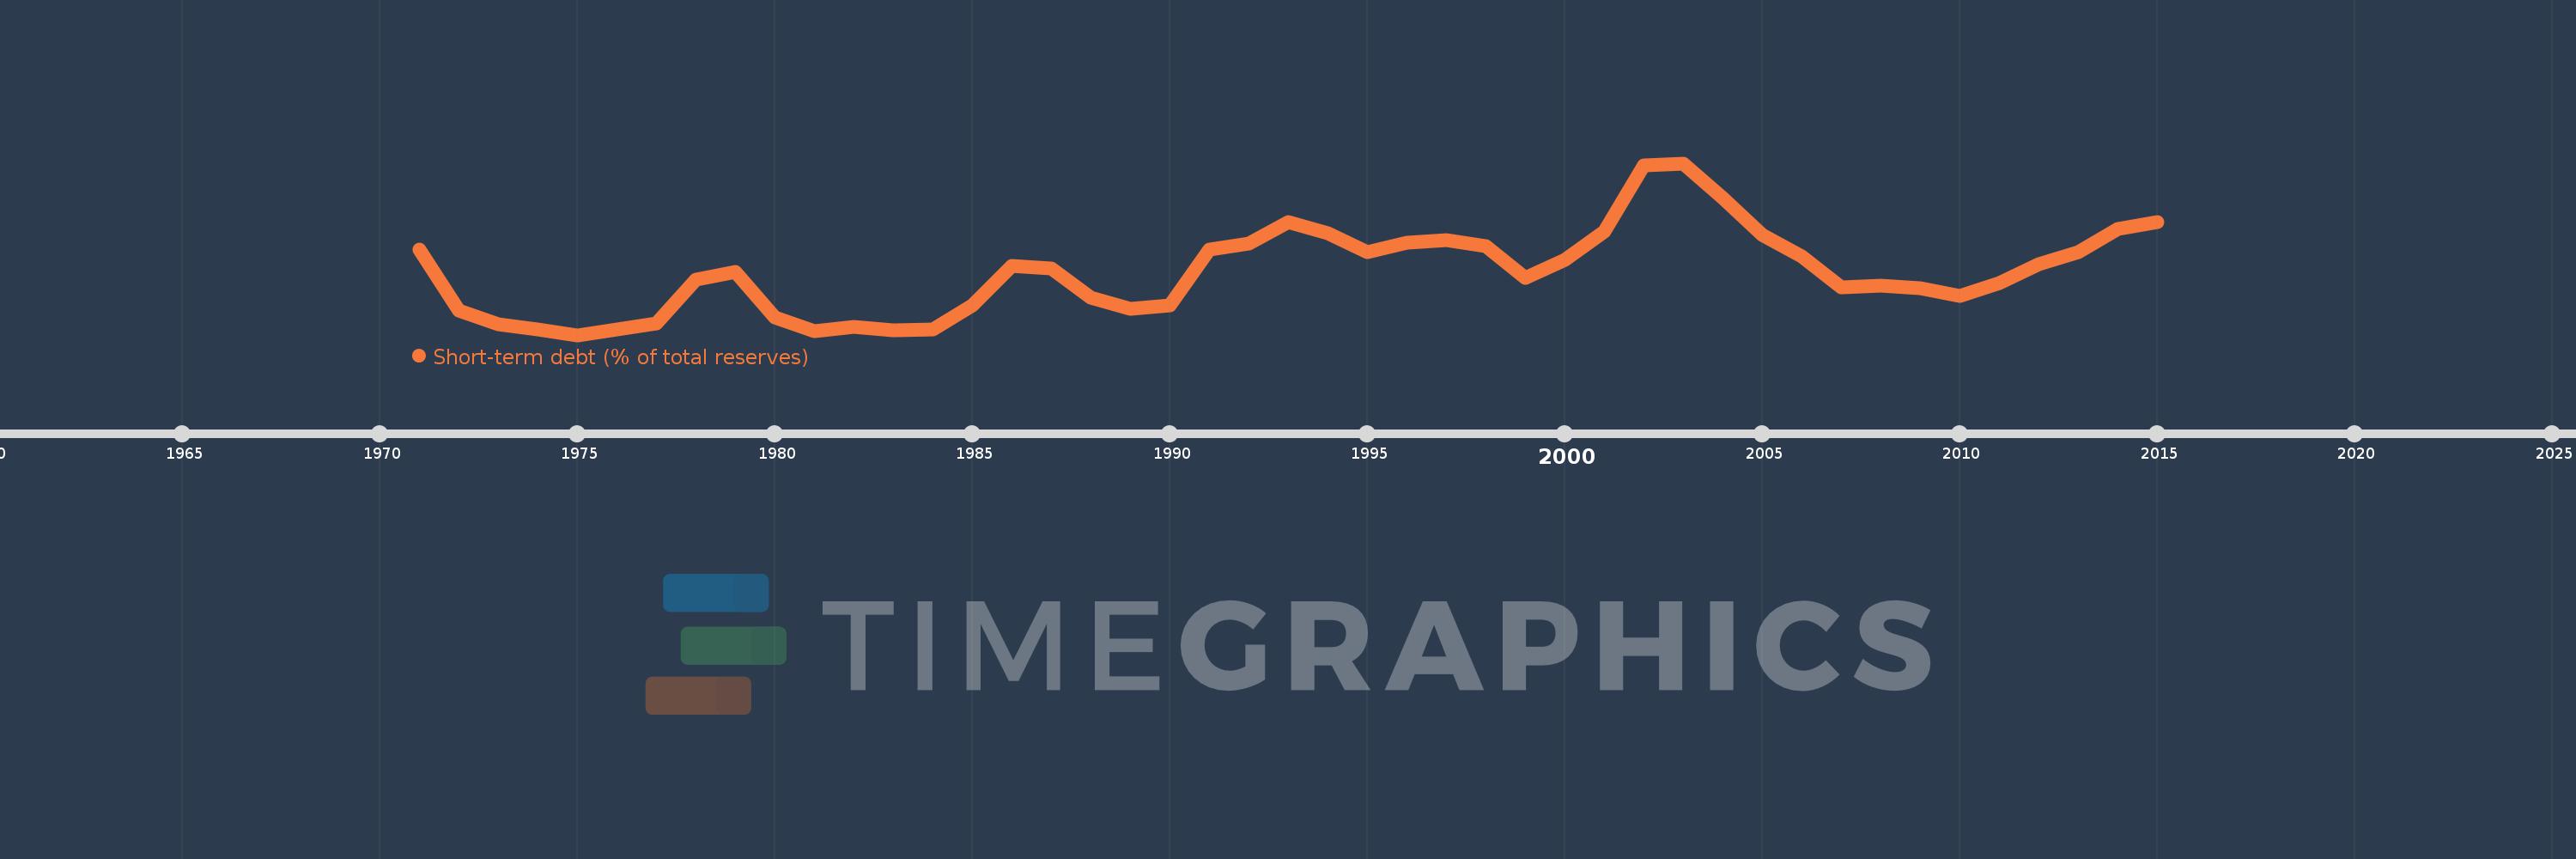
Short-term debt (% of total reserves)
2015,2014,2013,2012,2011,2010,2009,2008,2007,2006,2005,2004,2003,2002,2001,2000,1999,1998,1997,1996,1995,1994,1993,1992,1991,1990,1989,1988,1987,1986,1985,1984,1983,1982,1981,1980,1979,1978,1977,1976,1975,1974,1973,1972,1971
This statistics in other country:
Timeline:
This timeline shows a graph from 1971 to 2015 of Tunisia. No data until 1970. Number of actual observations by date: 45.
Source name:
World Development Indicators
Source organization:
World Bank, International Debt Statistics.
Categories, topics:
Economy & Growth, External Debt
Last updated:
apr 23, 2017
Indicators value changes by year
Minimum:
16.709
jan 1, 1975
Maximum:
130.278
jan 1, 2003
At the date of observation
Value
Absolute change
Change from previous value
jan 1, 1971
73.458
+73.458
0.0%
jan 1, 1972
33.001
-40.457
-55.08%
jan 1, 1973
23.875
-9.126
-27.65%
jan 1, 1974
20.244
-3.631
-15.21%
jan 1, 1975
16.709
-3.535
-17.46%
jan 1, 1976
20.353
+3.644
21.81%
jan 1, 1977
24.267
+3.914
19.23%
jan 1, 1978
53.484
+29.217
120.4%
jan 1, 1979
58.669
+5.185
9.69%
jan 1, 1980
28.506
-30.163
-51.41%
jan 1, 1981
19.471
-9.036
-31.7%
jan 1, 1982
21.874
+2.404
12.34%
jan 1, 1983
19.704
-2.17
-9.92%
jan 1, 1984
20.585
+0.88
4.47%
jan 1, 1985
36.494
+15.91
77.29%
jan 1, 1986
62.397
+25.903
70.98%
jan 1, 1987
60.453
-1.945
-3.12%
jan 1, 1988
41.38
-19.073
-31.55%
jan 1, 1989
34.286
-7.094
-17.14%
jan 1, 1990
36.237
+1.951
5.69%
jan 1, 1991
73.185
+36.949
101.96%
jan 1, 1992
77.384
+4.198
5.74%
jan 1, 1993
91.215
+13.831
17.87%
jan 1, 1994
84.127
-7.088
-7.77%
jan 1, 1995
71.634
-12.494
-14.85%
jan 1, 1996
77.558
+5.924
8.27%
jan 1, 1997
79.689
+2.131
2.75%
jan 1, 1998
75.403
-4.286
-5.38%
jan 1, 1999
54.393
-21.01
-27.86%
jan 1, 2000
66.148
+11.755
21.61%
jan 1, 2001
84.962
+18.814
28.44%
jan 1, 2002
128.954
+43.992
51.78%
jan 1, 2003
130.278
+1.324
1.03%
jan 1, 2004
107.521
-22.757
-17.47%
jan 1, 2005
82.979
-24.541
-22.82%
jan 1, 2006
68.926
-14.054
-16.94%
jan 1, 2007
48.261
-20.665
-29.98%
jan 1, 2008
49.614
+1.353
2.8%
jan 1, 2009
47.905
-1.708
-3.44%
jan 1, 2010
42.811
-5.094
-10.63%
jan 1, 2011
50.991
+8.179
19.11%
jan 1, 2012
63.573
+12.583
24.68%
jan 1, 2013
71.458
+7.885
12.4%
jan 1, 2014
87.044
+15.585
21.81%
jan 1, 2015
91.3
+4.257
4.89%
Ranking of countries by current statistics by years


Comments: