29
/
en
AIzaSyAYiBZKx7MnpbEhh9jyipgxe19OcubqV5w
April 1, 2024
112997
Costa Rica
CRI
true
2
1
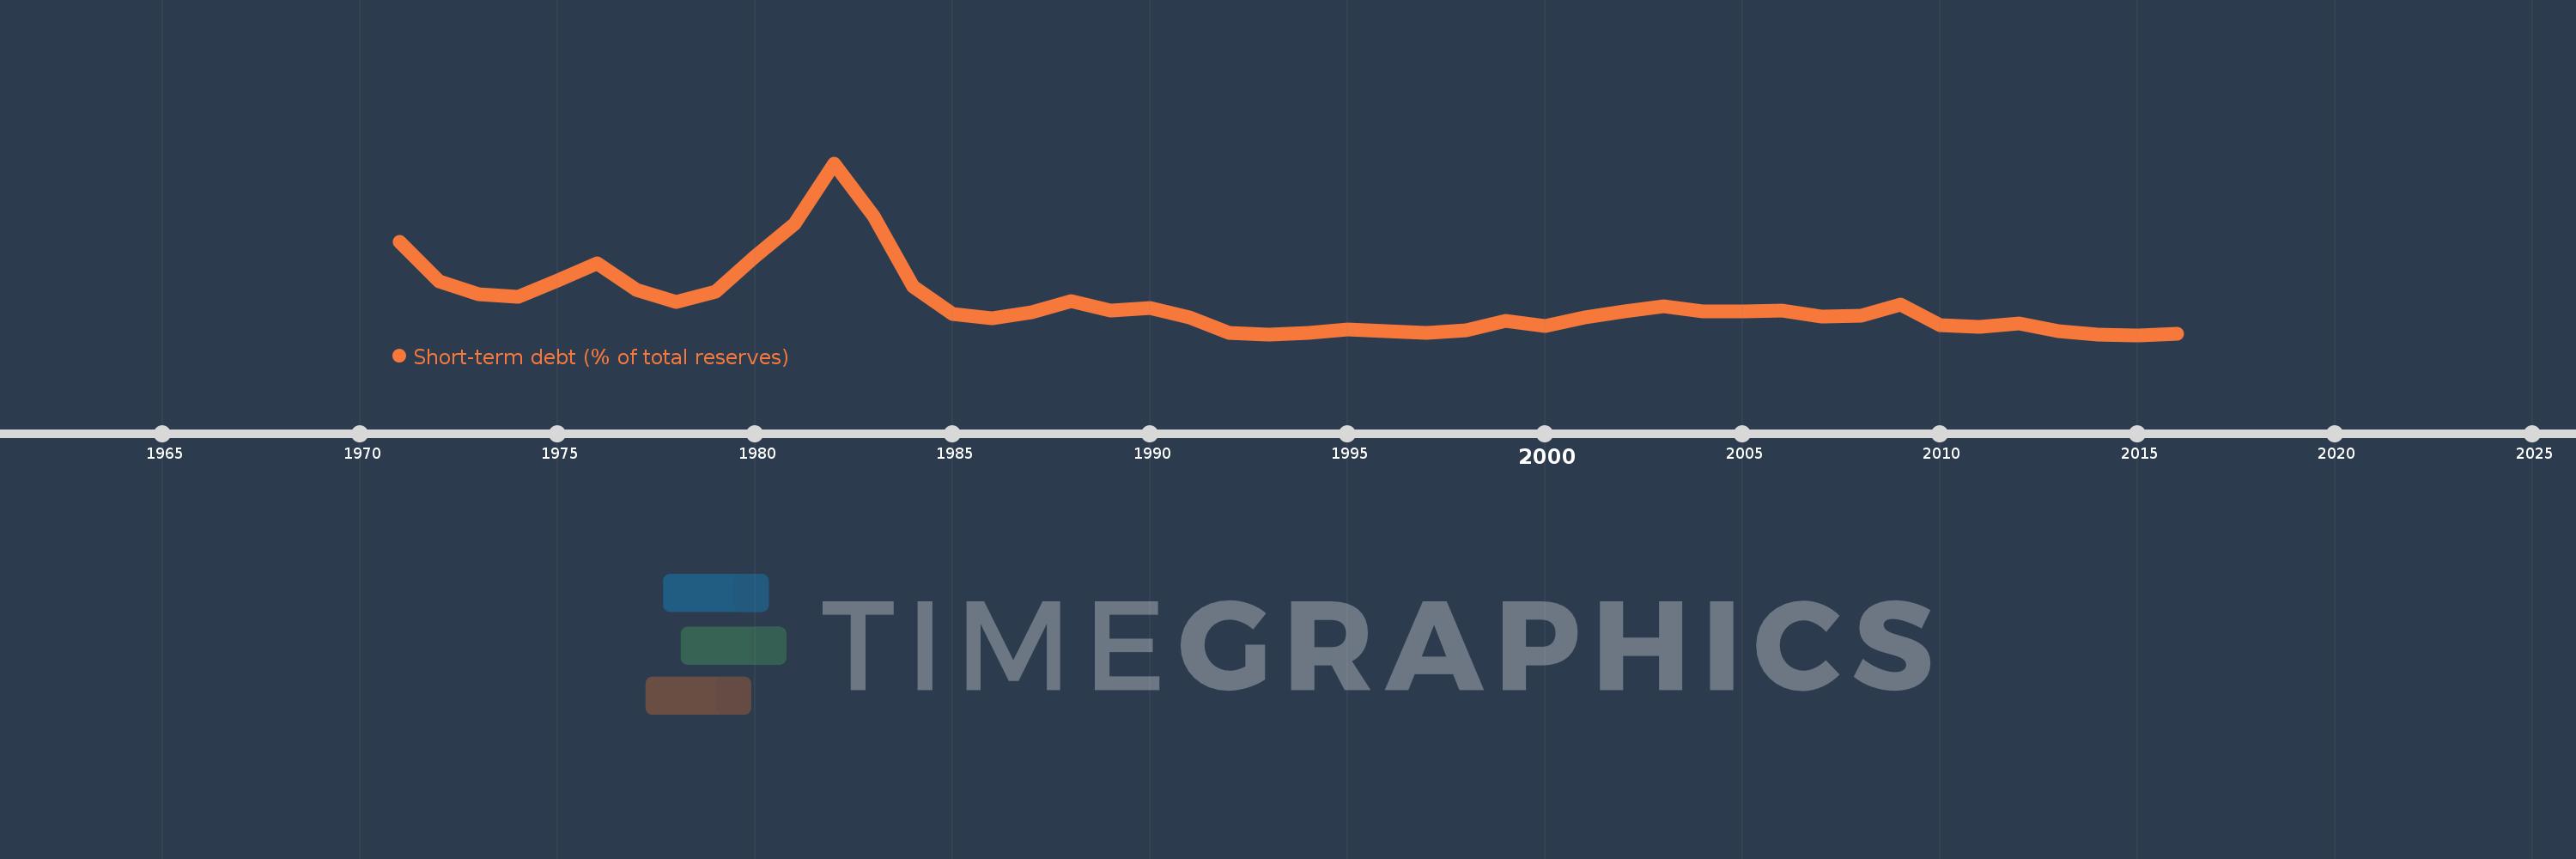
Short-term debt (% of total reserves)
2016,2015,2014,2013,2012,2011,2010,2009,2008,2007,2006,2005,2004,2003,2002,2001,2000,1999,1998,1997,1996,1995,1994,1993,1992,1991,1990,1989,1988,1987,1986,1985,1984,1983,1982,1981,1980,1979,1978,1977,1976,1975,1974,1973,1972,1971
This statistics in other country:
Timeline:
This timeline shows a graph from 1971 to 2016 of Costa Rica. No data until 1970. Number of actual observations by date: 46.
Source name:
World Development Indicators
Source organization:
World Bank, International Debt Statistics.
Categories, topics:
Economy & Growth, External Debt
Last updated:
apr 23, 2017
Indicators value changes by year
Minimum:
32.542
jan 1, 2015
Maximum:
435.171
jan 1, 1982
At the date of observation
Value
Absolute change
Change from previous value
jan 1, 1971
250.211
+250.211
0.0%
jan 1, 1972
157.796
-92.415
-36.93%
jan 1, 1973
128.141
-29.655
-18.79%
jan 1, 1974
121.582
-6.56
-5.12%
jan 1, 1975
159.655
+38.074
31.32%
jan 1, 1976
201.137
+41.481
25.98%
jan 1, 1977
137.28
-63.856
-31.75%
jan 1, 1978
110.097
-27.184
-19.8%
jan 1, 1979
134.111
+24.014
21.81%
jan 1, 1980
216.371
+82.261
61.34%
jan 1, 1981
292.396
+76.025
35.14%
jan 1, 1982
435.171
+142.775
48.83%
jan 1, 1983
311.64
-123.531
-28.39%
jan 1, 1984
145.984
-165.655
-53.16%
jan 1, 1985
82.206
-63.778
-43.69%
jan 1, 1986
72.374
-9.832
-11.96%
jan 1, 1987
86.301
+13.927
19.24%
jan 1, 1988
112.557
+26.257
30.42%
jan 1, 1989
88.953
-23.604
-20.97%
jan 1, 1990
95.479
+6.526
7.34%
jan 1, 1991
73.359
-22.12
-23.17%
jan 1, 1992
37.923
-35.436
-48.3%
jan 1, 1993
34.407
-3.516
-9.27%
jan 1, 1994
37.072
+2.665
7.75%
jan 1, 1995
44.996
+7.924
21.38%
jan 1, 1996
41.805
-3.192
-7.09%
jan 1, 1997
38.507
-3.298
-7.89%
jan 1, 1998
43.287
+4.78
12.41%
jan 1, 1999
65.453
+22.166
51.21%
jan 1, 2000
53.68
-11.773
-17.99%
jan 1, 2001
72.989
+19.309
35.97%
jan 1, 2002
87.749
+14.76
20.22%
jan 1, 2003
100.132
+12.383
14.11%
jan 1, 2004
88.713
-11.419
-11.4%
jan 1, 2005
86.985
-1.728
-1.95%
jan 1, 2006
90.626
+3.641
4.19%
jan 1, 2007
75.567
-15.059
-16.62%
jan 1, 2008
78.577
+3.01
3.98%
jan 1, 2009
104.95
+26.373
33.56%
jan 1, 2010
55.173
-49.777
-47.43%
jan 1, 2011
52.536
-2.637
-4.78%
jan 1, 2012
59.089
+6.553
12.47%
jan 1, 2013
42.346
-16.743
-28.34%
jan 1, 2014
32.887
-9.458
-22.34%
jan 1, 2015
32.542
-0.345
-1.05%
jan 1, 2016
35.182
+2.64
8.11%
Ranking of countries by current statistics by years


Comments: