29
/
en
AIzaSyAYiBZKx7MnpbEhh9jyipgxe19OcubqV5w
April 1, 2024
26920
Early-demographic dividend
EAR
false
2
1
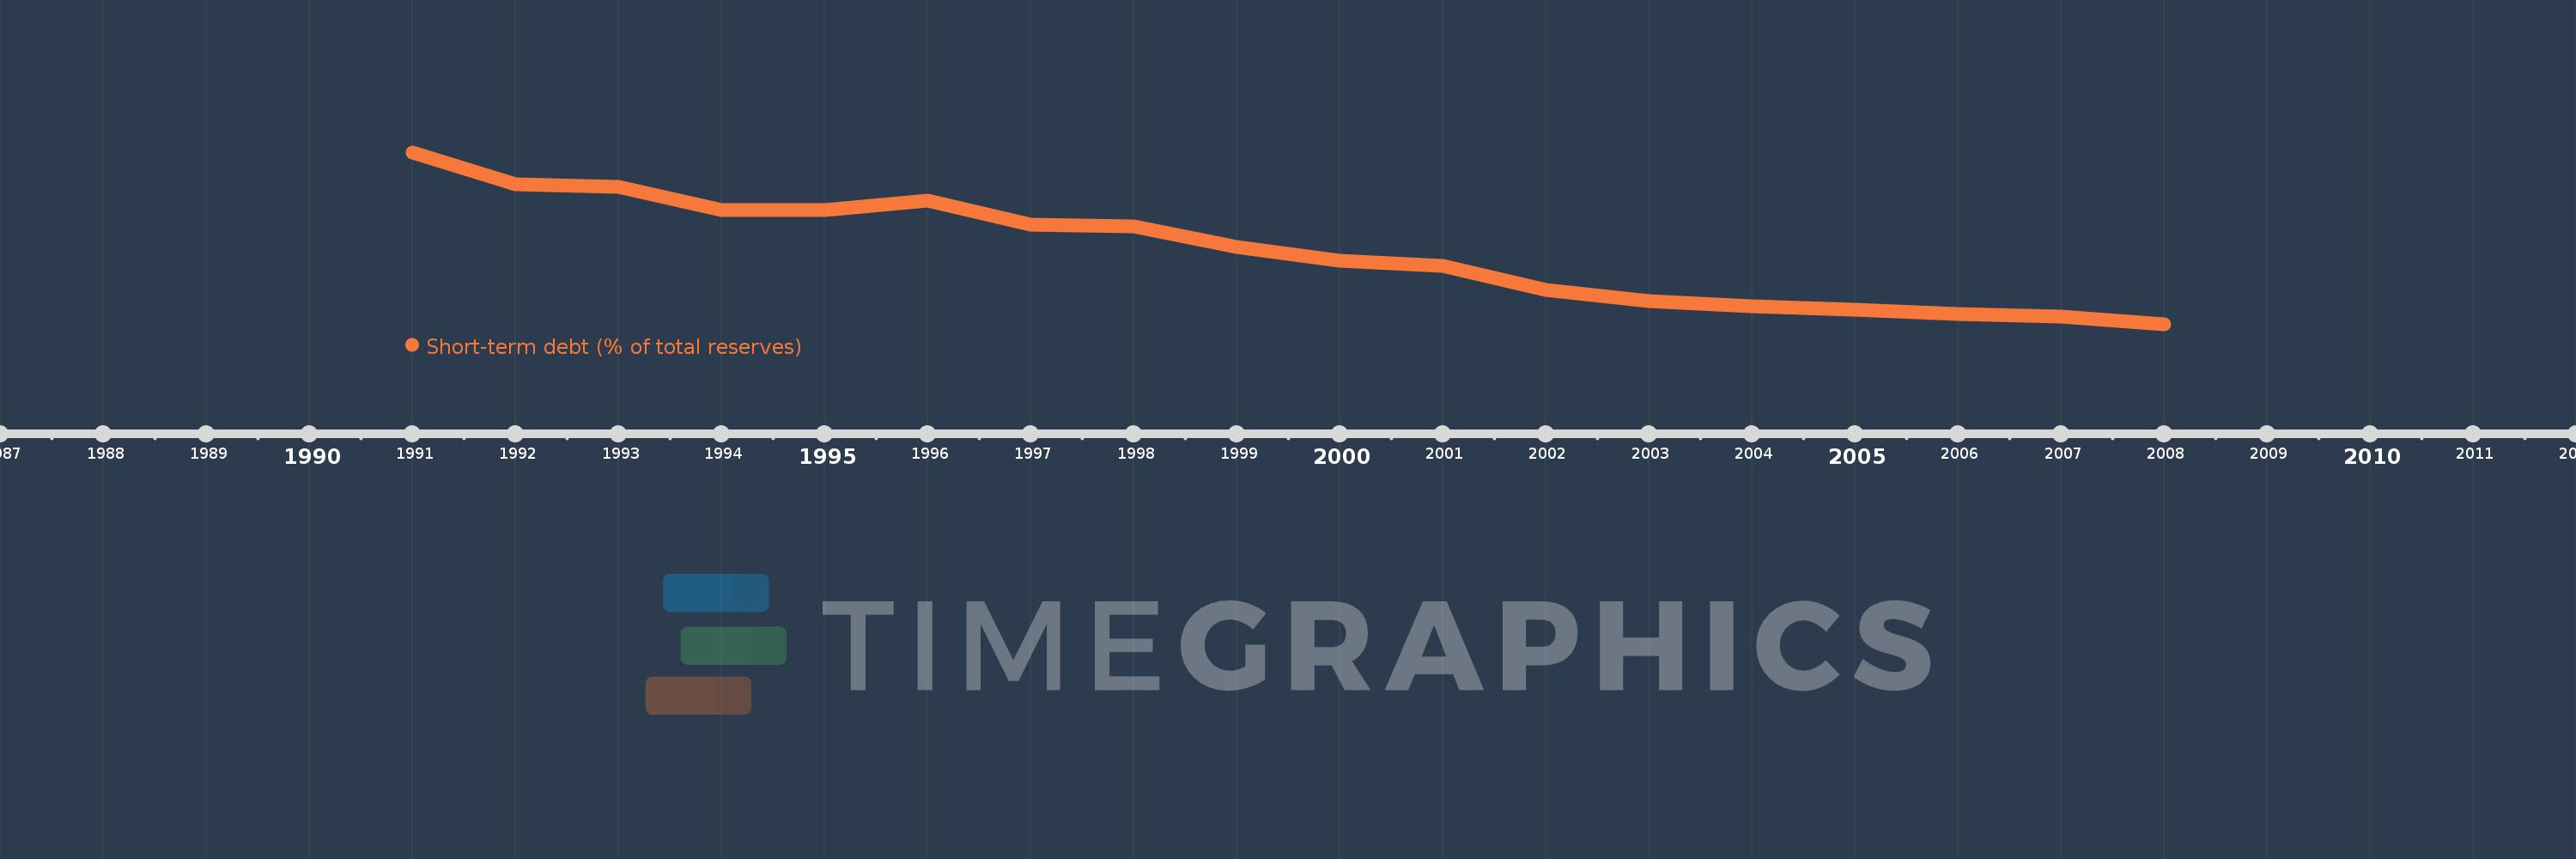
Short-term debt (% of total reserves)
2008,2007,2006,2005,2004,2003,2002,2001,2000,1999,1998,1997,1996,1995,1994,1993,1992,1991
This statistics in other country:
Timeline:
This timeline shows a graph from 1991 to 2008 of Early-demographic dividend. No data until 1990. Number of actual observations by date: 18.
Source name:
World Development Indicators
Source organization:
World Bank, International Debt Statistics.
Categories, topics:
Economy & Growth, External Debt
Last updated:
apr 23, 2017
Indicators value changes by year
Minimum:
25.177
jan 1, 2008
Maximum:
119.57
jan 1, 1991
At the date of observation
Value
Absolute change
Change from previous value
jan 1, 1991
119.57
+119.57
0.0%
jan 1, 1992
101.846
-17.724
-14.82%
jan 1, 1993
100.657
-1.189
-1.17%
jan 1, 1994
88.083
-12.574
-12.49%
jan 1, 1995
87.833
-0.25
-0.28%
jan 1, 1996
93.081
+5.248
5.97%
jan 1, 1997
79.893
-13.188
-14.17%
jan 1, 1998
78.882
-1.011
-1.27%
jan 1, 1999
67.786
-11.096
-14.07%
jan 1, 2000
60.083
-7.703
-11.36%
jan 1, 2001
57.185
-2.898
-4.82%
jan 1, 2002
44.008
-13.177
-23.04%
jan 1, 2003
38.06
-5.948
-13.52%
jan 1, 2004
34.85
-3.21
-8.43%
jan 1, 2005
33.236
-1.614
-4.63%
jan 1, 2006
30.66
-2.576
-7.75%
jan 1, 2007
29.413
-1.247
-4.07%
jan 1, 2008
25.177
-4.237
-14.4%
Ranking of countries by current statistics by years


Comments: