29
/
en
AIzaSyAYiBZKx7MnpbEhh9jyipgxe19OcubqV5w
April 1, 2024
220241
Papua New Guinea
PNG
true
2
1
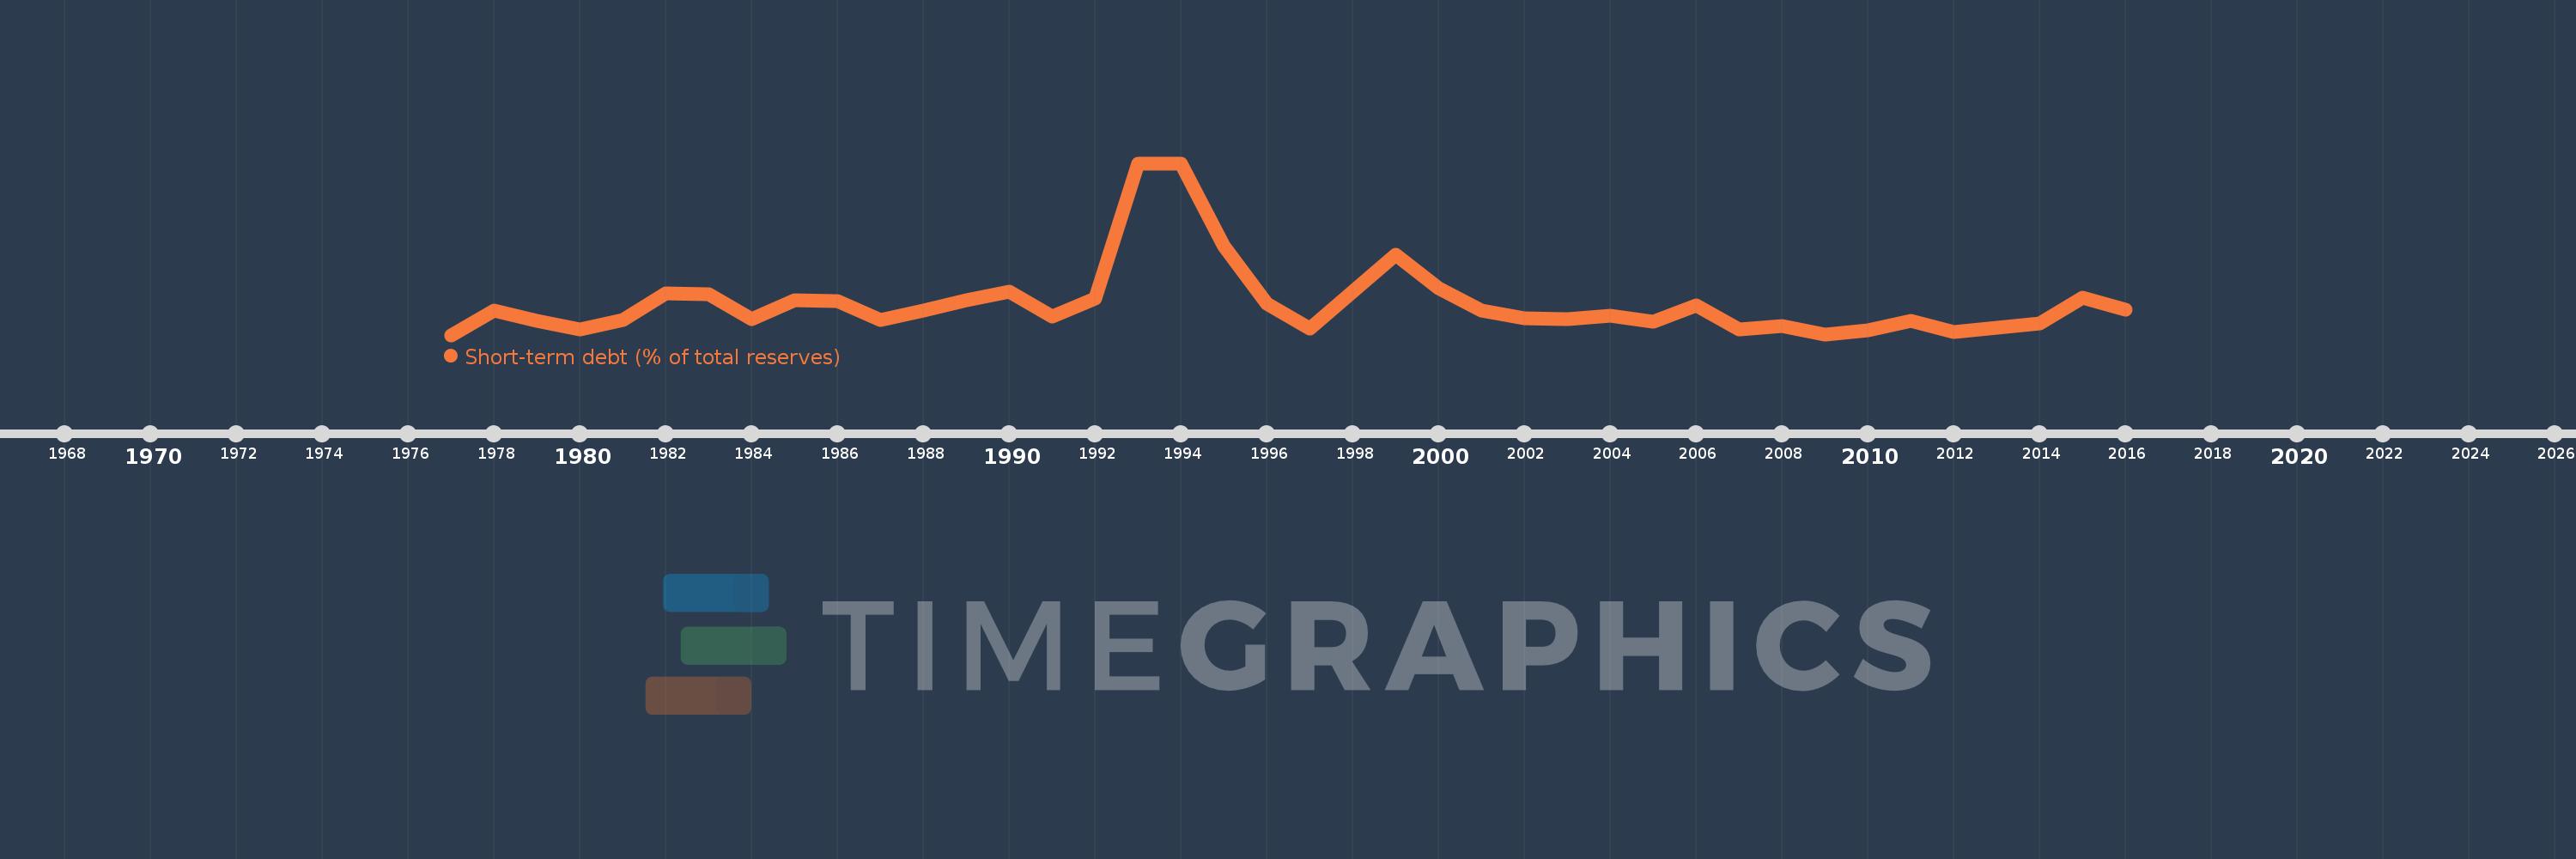
Short-term debt (% of total reserves)
2016,2015,2014,2013,2012,2011,2010,2009,2008,2007,2006,2005,2004,2003,2002,2001,2000,1999,1998,1997,1996,1995,1994,1993,1992,1991,1990,1989,1988,1987,1986,1985,1984,1983,1982,1981,1980,1979,1978,1977
This statistics in other country:
Timeline:
This timeline shows a graph from 1977 to 2016 of Papua New Guinea. No data until 1976. Number of actual observations by date: 40.
Source name:
World Development Indicators
Source organization:
World Bank, International Debt Statistics.
Categories, topics:
Economy & Growth, External Debt
Last updated:
apr 23, 2017
Indicators value changes by year
Maximum:
158.939
jan 1, 1994
At the date of observation
Value
Absolute change
Change from previous value
jan 1, 1978
22.95
+22.95
%
jan 1, 1979
12.779
-10.172
-44.32%
jan 1, 1980
5.275
-7.504
-58.72%
jan 1, 1981
13.981
+8.706
165.04%
jan 1, 1982
38.49
+24.509
175.3%
jan 1, 1983
37.808
-0.683
-1.77%
jan 1, 1984
14.441
-23.367
-61.8%
jan 1, 1985
31.897
+17.456
120.88%
jan 1, 1986
31.524
-0.373
-1.17%
jan 1, 1987
13.775
-17.748
-56.3%
jan 1, 1988
22.468
+8.693
63.1%
jan 1, 1989
32.17
+9.702
43.18%
jan 1, 1990
40.201
+8.031
24.96%
jan 1, 1991
16.759
-23.442
-58.31%
jan 1, 1992
33.976
+17.217
102.73%
jan 1, 1993
158.813
+124.837
367.42%
jan 1, 1994
158.939
+0.127
0.08%
jan 1, 1995
82.357
-76.582
-48.18%
jan 1, 1996
29.105
-53.252
-64.66%
jan 1, 1997
5.567
-23.538
-80.87%
jan 1, 1998
40.424
+34.857
626.15%
jan 1, 1999
74.275
+33.851
83.74%
jan 1, 2000
43.621
-30.655
-41.27%
jan 1, 2001
23.014
-20.606
-47.24%
jan 1, 2002
15.225
-7.789
-33.85%
jan 1, 2003
14.573
-0.652
-4.28%
jan 1, 2004
18.061
+3.488
23.93%
jan 1, 2005
12.118
-5.943
-32.9%
jan 1, 2006
27.585
+15.466
127.63%
jan 1, 2007
5.483
-22.101
-80.12%
jan 1, 2008
8.261
+2.778
50.66%
jan 1, 2009
0.498
-7.763
-93.97%
jan 1, 2010
4.26
+3.762
755.49%
jan 1, 2011
13.264
+9.004
211.37%
jan 1, 2012
2.826
-10.438
-78.7%
jan 1, 2013
6.472
+3.646
129.02%
jan 1, 2014
11.014
+4.543
70.19%
jan 1, 2015
34.693
+23.678
214.98%
jan 1, 2016
23.792
-10.901
-31.42%
Ranking of countries by current statistics by years


Comments: