29
/
en
AIzaSyAYiBZKx7MnpbEhh9jyipgxe19OcubqV5w
April 1, 2024
103068
Central African Republic
CAF
true
2
1
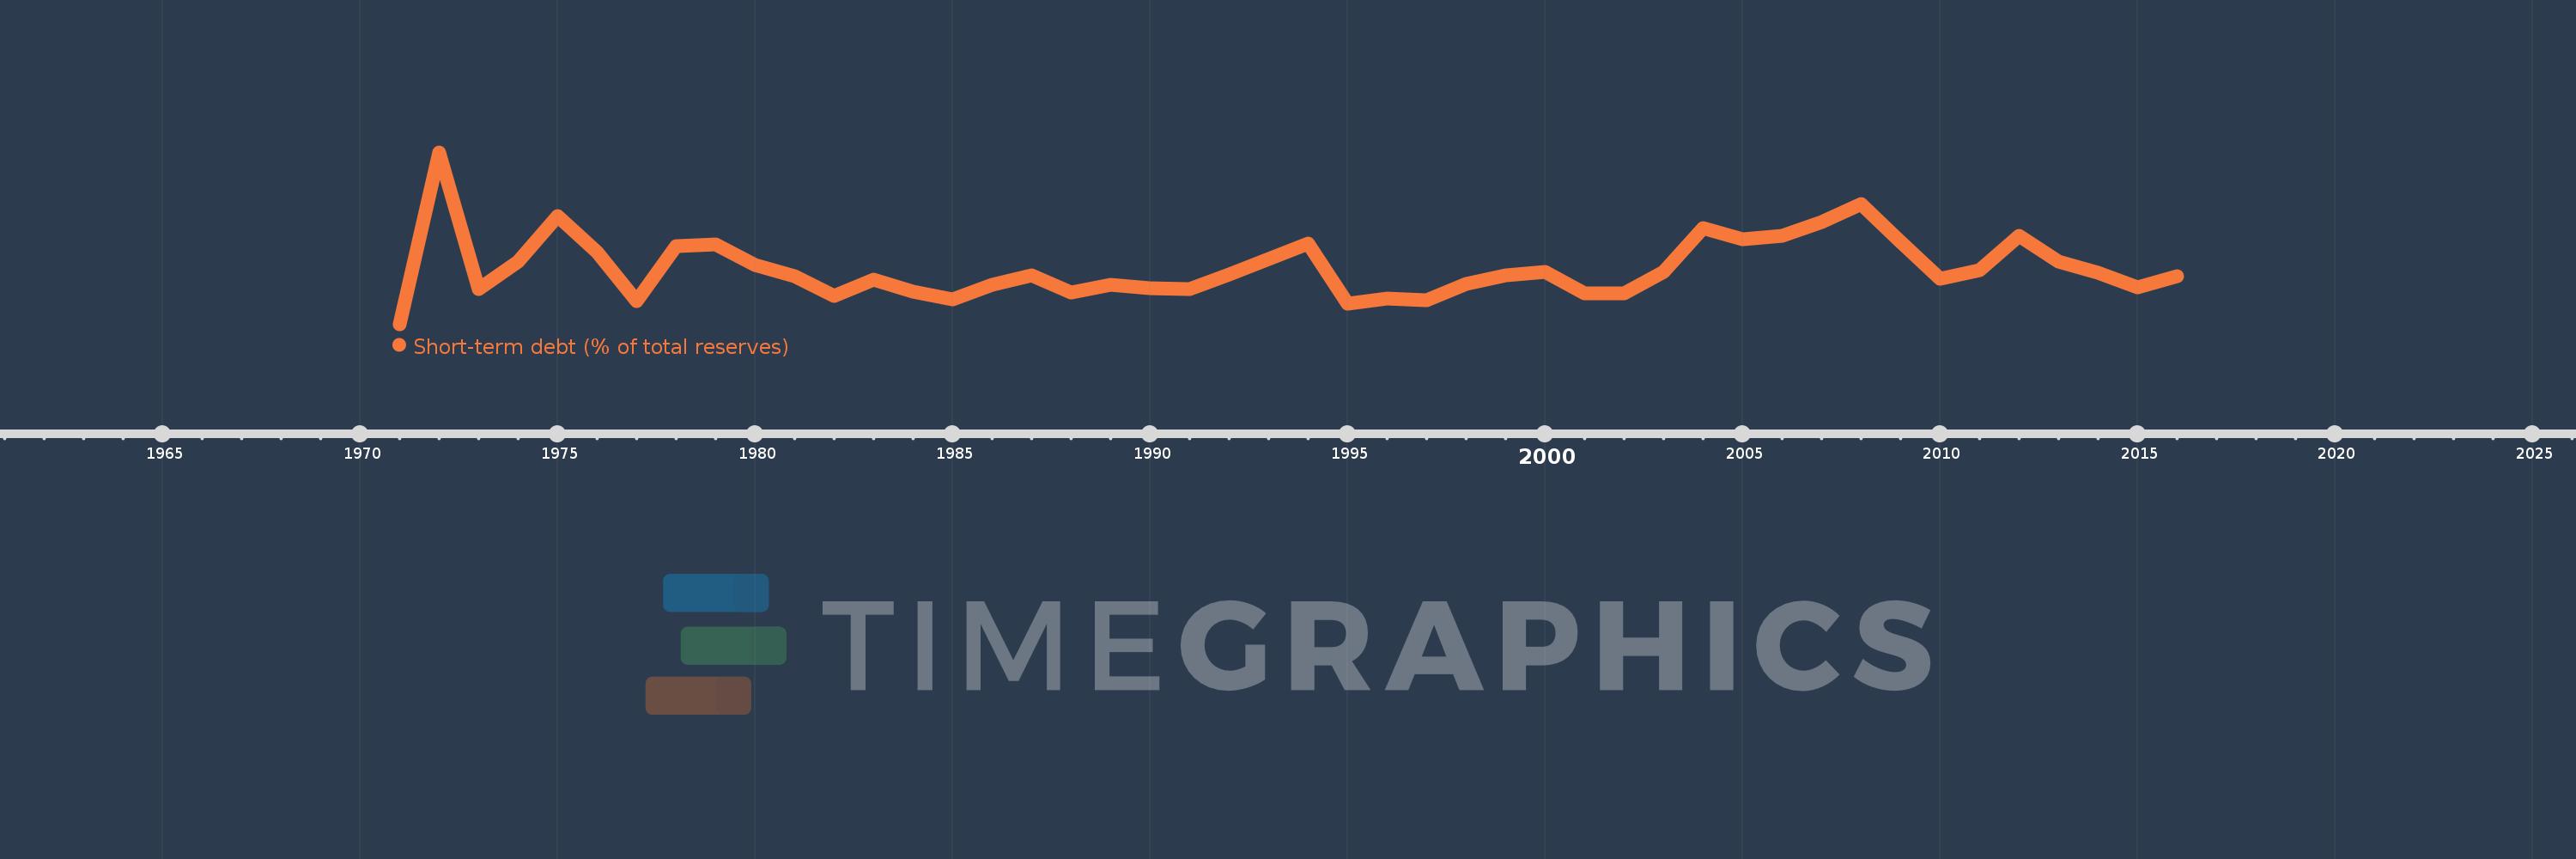
Short-term debt (% of total reserves)
2016,2015,2014,2013,2012,2011,2010,2009,2008,2007,2006,2005,2004,2003,2002,2001,2000,1999,1998,1997,1996,1995,1994,1993,1992,1991,1990,1989,1988,1987,1986,1985,1984,1983,1982,1981,1980,1979,1978,1977,1976,1975,1974,1973,1972,1971
This statistics in other country:
Timeline:
This timeline shows a graph from 1971 to 2016 of Central African Republic. No data until 1970. Number of actual observations by date: 46.
Source name:
World Development Indicators
Source organization:
World Bank, International Debt Statistics.
Categories, topics:
Economy & Growth, External Debt
Last updated:
apr 23, 2017
Indicators value changes by year
Maximum:
127.23
jan 1, 1972
At the date of observation
Value
Absolute change
Change from previous value
jan 1, 1971
6.194
+6.194
0.0%
jan 1, 1972
127.23
+121.036
1.95K%
jan 1, 1973
31.19
-96.04
-75.49%
jan 1, 1974
50.309
+19.118
61.3%
jan 1, 1975
82.491
+32.183
63.97%
jan 1, 1976
56.856
-25.635
-31.08%
jan 1, 1977
22.301
-34.555
-60.78%
jan 1, 1978
61.207
+38.906
174.46%
jan 1, 1979
62.227
+1.019
1.67%
jan 1, 1980
48.184
-14.043
-22.57%
jan 1, 1981
39.841
-8.343
-17.32%
jan 1, 1982
26.357
-13.484
-33.84%
jan 1, 1983
37.7
+11.343
43.04%
jan 1, 1984
29.213
-8.486
-22.51%
jan 1, 1985
23.712
-5.501
-18.83%
jan 1, 1986
33.942
+10.229
43.14%
jan 1, 1987
40.57
+6.629
19.53%
jan 1, 1988
28.773
-11.798
-29.08%
jan 1, 1989
33.981
+5.208
18.1%
jan 1, 1990
31.297
-2.684
-7.9%
jan 1, 1991
30.708
-0.589
-1.88%
jan 1, 1992
41.113
+10.405
33.88%
jan 1, 1993
51.908
+10.795
26.26%
jan 1, 1994
62.868
+10.96
21.11%
jan 1, 1995
20.657
-42.21
-67.14%
jan 1, 1996
24.011
+3.353
16.23%
jan 1, 1997
23.163
-0.848
-3.53%
jan 1, 1998
34.568
+11.405
49.24%
jan 1, 1999
40.382
+5.814
16.82%
jan 1, 2000
43.181
+2.799
6.93%
jan 1, 2001
27.918
-15.264
-35.35%
jan 1, 2002
27.843
-0.075
-0.27%
jan 1, 2003
43.181
+15.338
55.09%
jan 1, 2004
73.848
+30.668
71.02%
jan 1, 2005
65.844
-8.005
-10.84%
jan 1, 2006
68.718
+2.874
4.36%
jan 1, 2007
78.267
+9.549
13.9%
jan 1, 2008
91.067
+12.8
16.35%
jan 1, 2009
64.37
-26.697
-29.32%
jan 1, 2010
38.33
-26.04
-40.45%
jan 1, 2011
44.541
+6.211
16.2%
jan 1, 2012
68.664
+24.123
54.16%
jan 1, 2013
50.594
-18.07
-26.32%
jan 1, 2014
42.705
-7.888
-15.59%
jan 1, 2015
32.196
-10.509
-24.61%
jan 1, 2016
40.044
+7.848
24.37%
Ranking of countries by current statistics by years


Comments: