29
/
en
AIzaSyAYiBZKx7MnpbEhh9jyipgxe19OcubqV5w
April 1, 2024
96806
Burundi
BDI
true
2
1
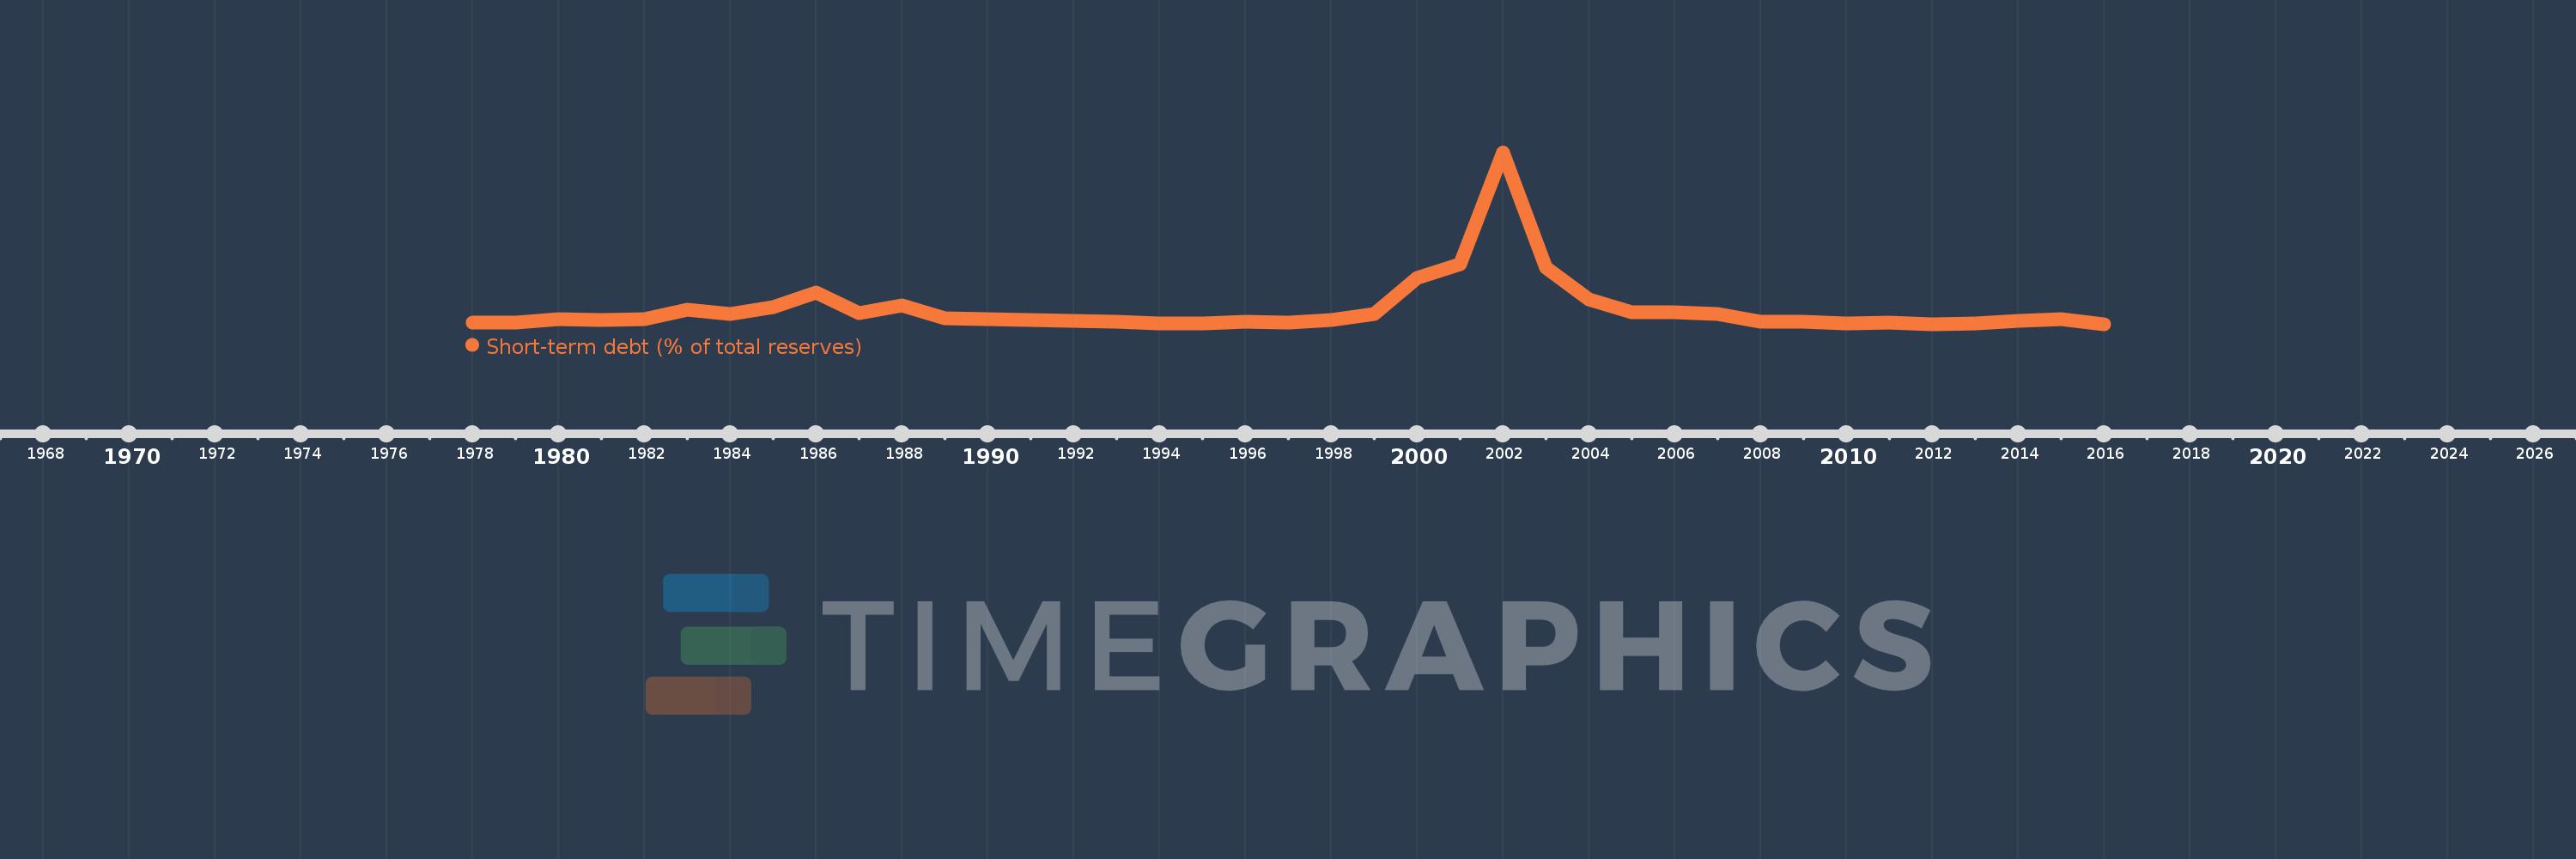
Short-term debt (% of total reserves)
2016,2015,2014,2013,2012,2011,2010,2009,2008,2007,2006,2005,2004,2003,2002,2001,2000,1999,1998,1997,1996,1995,1994,1993,1992,1991,1990,1989,1988,1987,1986,1985,1984,1983,1982,1981,1980,1979,1978
This statistics in other country:
Timeline:
This timeline shows a graph from 1978 to 2016 of Burundi. No data until 1977. Number of actual observations by date: 39.
Source name:
World Development Indicators
Source organization:
World Bank, International Debt Statistics.
Categories, topics:
Economy & Growth, External Debt
Last updated:
apr 23, 2017
Indicators value changes by year
Maximum:
491.775
jan 1, 2002
At the date of observation
Value
Absolute change
Change from previous value
jan 1, 1978
5.213
+5.213
0.0%
jan 1, 1979
5.998
+0.785
15.05%
jan 1, 1980
13.44
+7.442
124.07%
jan 1, 1981
11.466
-1.974
-14.69%
jan 1, 1982
14.674
+3.208
27.98%
jan 1, 1983
42.829
+28.155
191.86%
jan 1, 1984
29.843
-12.987
-30.32%
jan 1, 1985
48.033
+18.191
60.95%
jan 1, 1986
89.981
+41.948
87.33%
jan 1, 1987
31.749
-58.233
-64.72%
jan 1, 1988
54.033
+22.284
70.19%
jan 1, 1989
16.58
-37.453
-69.32%
jan 1, 1990
15.435
-1.145
-6.91%
jan 1, 1991
11.966
-3.469
-22.47%
jan 1, 1992
9.063
-2.903
-24.26%
jan 1, 1993
7.204
-1.859
-20.51%
jan 1, 1994
3.058
-4.147
-57.56%
jan 1, 1995
2.66
-0.397
-13.0%
jan 1, 1996
6.894
+4.234
159.17%
jan 1, 1997
5.627
-1.267
-18.38%
jan 1, 1998
13.391
+7.764
137.99%
jan 1, 1999
28.511
+15.12
112.91%
jan 1, 2000
131.538
+103.027
361.35%
jan 1, 2001
172.657
+41.119
31.26%
jan 1, 2002
491.775
+319.118
184.83%
jan 1, 2003
162.996
-328.779
-66.86%
jan 1, 2004
70.596
-92.4
-56.69%
jan 1, 2005
34.092
-36.504
-51.71%
jan 1, 2006
33.864
-0.228
-0.67%
jan 1, 2007
28.685
-5.179
-15.29%
jan 1, 2008
7.791
-20.894
-72.84%
jan 1, 2009
6.749
-1.042
-13.38%
jan 1, 2010
2.167
-4.582
-67.9%
jan 1, 2011
4.739
+2.573
118.75%
jan 1, 2012
0.143
-4.596
-96.98%
jan 1, 2013
2.353
+2.21
1.54K%
jan 1, 2014
9.494
+7.141
303.49%
jan 1, 2015
15.219
+5.725
60.3%
jan 1, 2016
0.195
-15.024
-98.72%
Ranking of countries by current statistics by years


Comments: