29
/
en
AIzaSyAYiBZKx7MnpbEhh9jyipgxe19OcubqV5w
April 1, 2024
110372
Congo, Dem. Rep.
COD
true
2
1
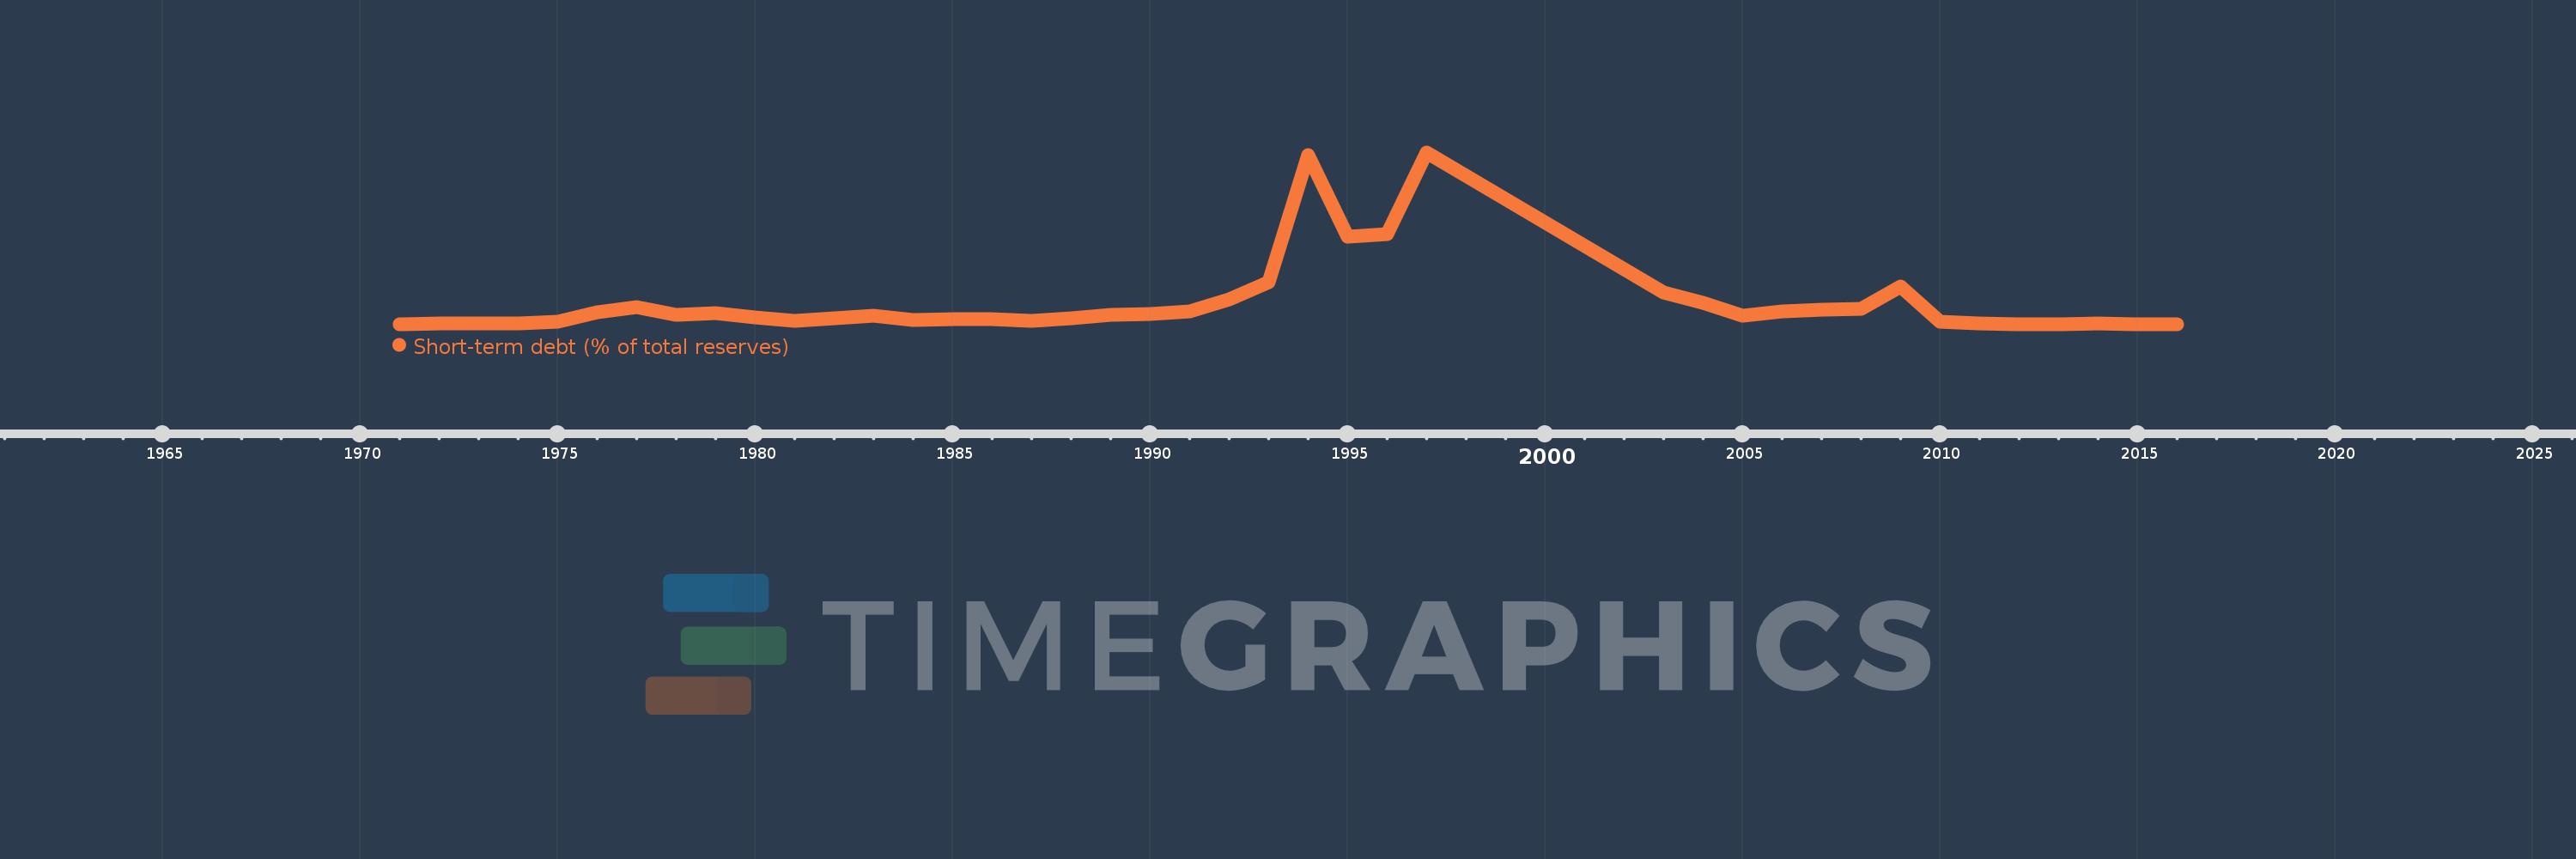
Short-term debt (% of total reserves)
2016,2015,2014,2013,2012,2011,2010,2009,2008,2007,2006,2005,2004,2003,1997,1996,1995,1994,1993,1992,1991,1990,1989,1988,1987,1986,1985,1984,1983,1982,1981,1980,1979,1978,1977,1976,1975,1974,1973,1972,1971
This statistics in other country:
Timeline:
This timeline shows a graph from 1971 to 2016 of Congo, Dem. Rep.. No data until 1970. Number of actual observations by date: 41.
Source name:
World Development Indicators
Source organization:
World Bank, International Debt Statistics.
Categories, topics:
Economy & Growth, External Debt
Last updated:
apr 23, 2017
Indicators value changes by year
Minimum:
11.941
jan 1, 2015
Maximum:
3.784K
jan 1, 1997
At the date of observation
Value
Absolute change
Change from previous value
jan 1, 1971
17.965
+17.965
0.0%
jan 1, 1972
26.033
+8.067
44.9%
jan 1, 1973
30.338
+4.305
16.54%
jan 1, 1974
30.293
-0.045
-0.15%
jan 1, 1975
73.006
+42.713
141.0%
jan 1, 1976
268.399
+195.393
267.64%
jan 1, 1977
384.835
+116.436
43.38%
jan 1, 1978
220.069
-164.766
-42.81%
jan 1, 1979
247.177
+27.108
12.32%
jan 1, 1980
163.993
-83.184
-33.65%
jan 1, 1981
85.767
-78.226
-47.7%
jan 1, 1982
133.462
+47.695
55.61%
jan 1, 1983
204.668
+71.206
53.35%
jan 1, 1984
104.079
-100.589
-49.15%
jan 1, 1985
117.68
+13.601
13.07%
jan 1, 1986
120.96
+3.28
2.79%
jan 1, 1987
92.532
-28.428
-23.5%
jan 1, 1988
139.964
+47.432
51.26%
jan 1, 1989
224.724
+84.76
60.56%
jan 1, 1990
229.104
+4.38
1.95%
jan 1, 1991
285.253
+56.149
24.51%
jan 1, 1992
560.82
+275.568
96.6%
jan 1, 1993
937.961
+377.141
67.25%
jan 1, 1994
3.72K
+2.783K
296.65%
jan 1, 1995
1.94K
-1.78K
-47.85%
jan 1, 1996
1.981K
+40.588
2.09%
jan 1, 1997
3.784K
+1.803K
91.01%
jan 1, 2003
716.278
-3.067K
-81.07%
jan 1, 2004
480.793
-235.485
-32.88%
jan 1, 2005
197.681
-283.112
-58.88%
jan 1, 2006
287.678
+89.997
45.53%
jan 1, 2007
330.342
+42.664
14.83%
jan 1, 2008
343.263
+12.921
3.91%
jan 1, 2009
845.026
+501.763
146.17%
jan 1, 2010
60.076
-784.949
-92.89%
jan 1, 2011
33.709
-26.367
-43.89%
jan 1, 2012
17.91
-15.799
-46.87%
jan 1, 2013
16.023
-1.887
-10.54%
jan 1, 2014
26.507
+10.484
65.43%
jan 1, 2015
11.941
-14.565
-54.95%
jan 1, 2016
15.041
+3.099
25.95%
Ranking of countries by current statistics by years


Comments: