29
/
en
AIzaSyAYiBZKx7MnpbEhh9jyipgxe19OcubqV5w
April 1, 2024
168226
Kenya
KEN
true
2
1
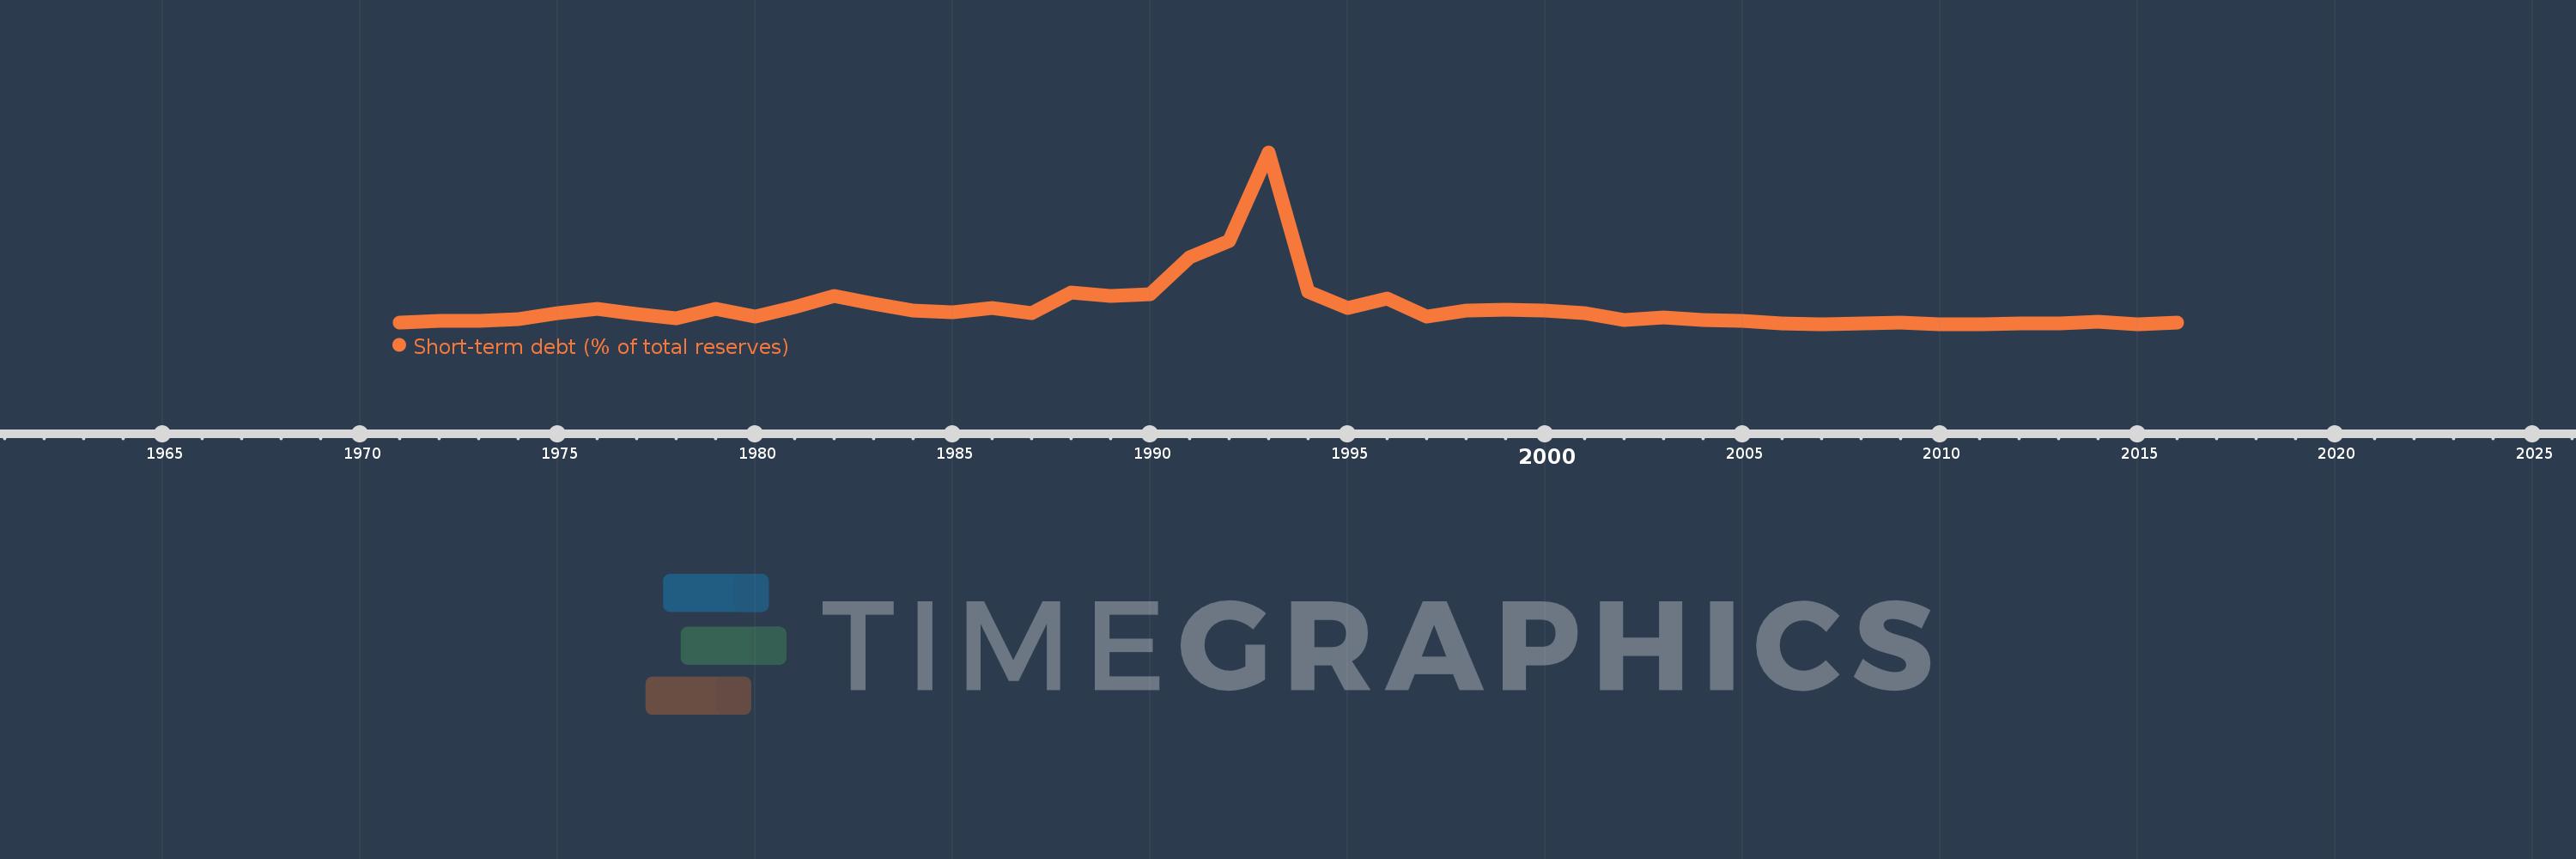
Short-term debt (% of total reserves)
2016,2015,2014,2013,2012,2011,2010,2009,2008,2007,2006,2005,2004,2003,2002,2001,2000,1999,1998,1997,1996,1995,1994,1993,1992,1991,1990,1989,1988,1987,1986,1985,1984,1983,1982,1981,1980,1979,1978,1977,1976,1975,1974,1973,1972,1971
This statistics in other country:
Timeline:
This timeline shows a graph from 1971 to 2016 of Kenya. No data until 1970. Number of actual observations by date: 46.
Source name:
World Development Indicators
Source organization:
World Bank, International Debt Statistics.
Categories, topics:
Economy & Growth, External Debt
Last updated:
apr 23, 2017
Indicators value changes by year
Minimum:
24.101
jan 1, 2011
Maximum:
976.426
jan 1, 1993
At the date of observation
Value
Absolute change
Change from previous value
jan 1, 1971
31.405
+31.405
0.0%
jan 1, 1972
42.119
+10.713
34.11%
jan 1, 1973
41.591
-0.527
-1.25%
jan 1, 1974
52.352
+10.761
25.87%
jan 1, 1975
85.884
+33.532
64.05%
jan 1, 1976
107.839
+21.955
25.56%
jan 1, 1977
78.4
-29.439
-27.3%
jan 1, 1978
57.628
-20.772
-26.49%
jan 1, 1979
109.264
+51.636
89.6%
jan 1, 1980
64.169
-45.095
-41.27%
jan 1, 1981
118.873
+54.704
85.25%
jan 1, 1982
178.92
+60.047
50.51%
jan 1, 1983
136.868
-42.051
-23.5%
jan 1, 1984
100.488
-36.38
-26.58%
jan 1, 1985
90.743
-9.745
-9.7%
jan 1, 1986
112.784
+22.041
24.29%
jan 1, 1987
83.694
-29.09
-25.79%
jan 1, 1988
200.98
+117.286
140.14%
jan 1, 1989
180.141
-20.839
-10.37%
jan 1, 1990
192.649
+12.507
6.94%
jan 1, 1991
395.69
+203.042
105.39%
jan 1, 1992
487.522
+91.832
23.21%
jan 1, 1993
976.426
+488.904
100.28%
jan 1, 1994
206.676
-769.75
-78.83%
jan 1, 1995
115.127
-91.549
-44.3%
jan 1, 1996
164.863
+49.735
43.2%
jan 1, 1997
68.011
-96.852
-58.75%
jan 1, 1998
98.187
+30.176
44.37%
jan 1, 1999
106.539
+8.352
8.51%
jan 1, 2000
98.439
-8.1
-7.6%
jan 1, 2001
84.28
-14.159
-14.38%
jan 1, 2002
49.727
-34.554
-41.0%
jan 1, 2003
61.636
+11.909
23.95%
jan 1, 2004
46.678
-14.958
-24.27%
jan 1, 2005
43.58
-3.098
-6.64%
jan 1, 2006
27.246
-16.333
-37.48%
jan 1, 2007
24.409
-2.837
-10.41%
jan 1, 2008
28.825
+4.416
18.09%
jan 1, 2009
33.01
+4.185
14.52%
jan 1, 2010
24.953
-8.057
-24.41%
jan 1, 2011
24.101
-0.852
-3.42%
jan 1, 2012
30.307
+6.206
25.75%
jan 1, 2013
27.604
-2.702
-8.92%
jan 1, 2014
36.668
+9.064
32.83%
jan 1, 2015
25.288
-11.38
-31.03%
jan 1, 2016
34.69
+9.401
37.18%
Ranking of countries by current statistics by years


Comments: