29
/
en
AIzaSyAYiBZKx7MnpbEhh9jyipgxe19OcubqV5w
April 1, 2024
75728
Azerbaijan
AZE
true
2
1
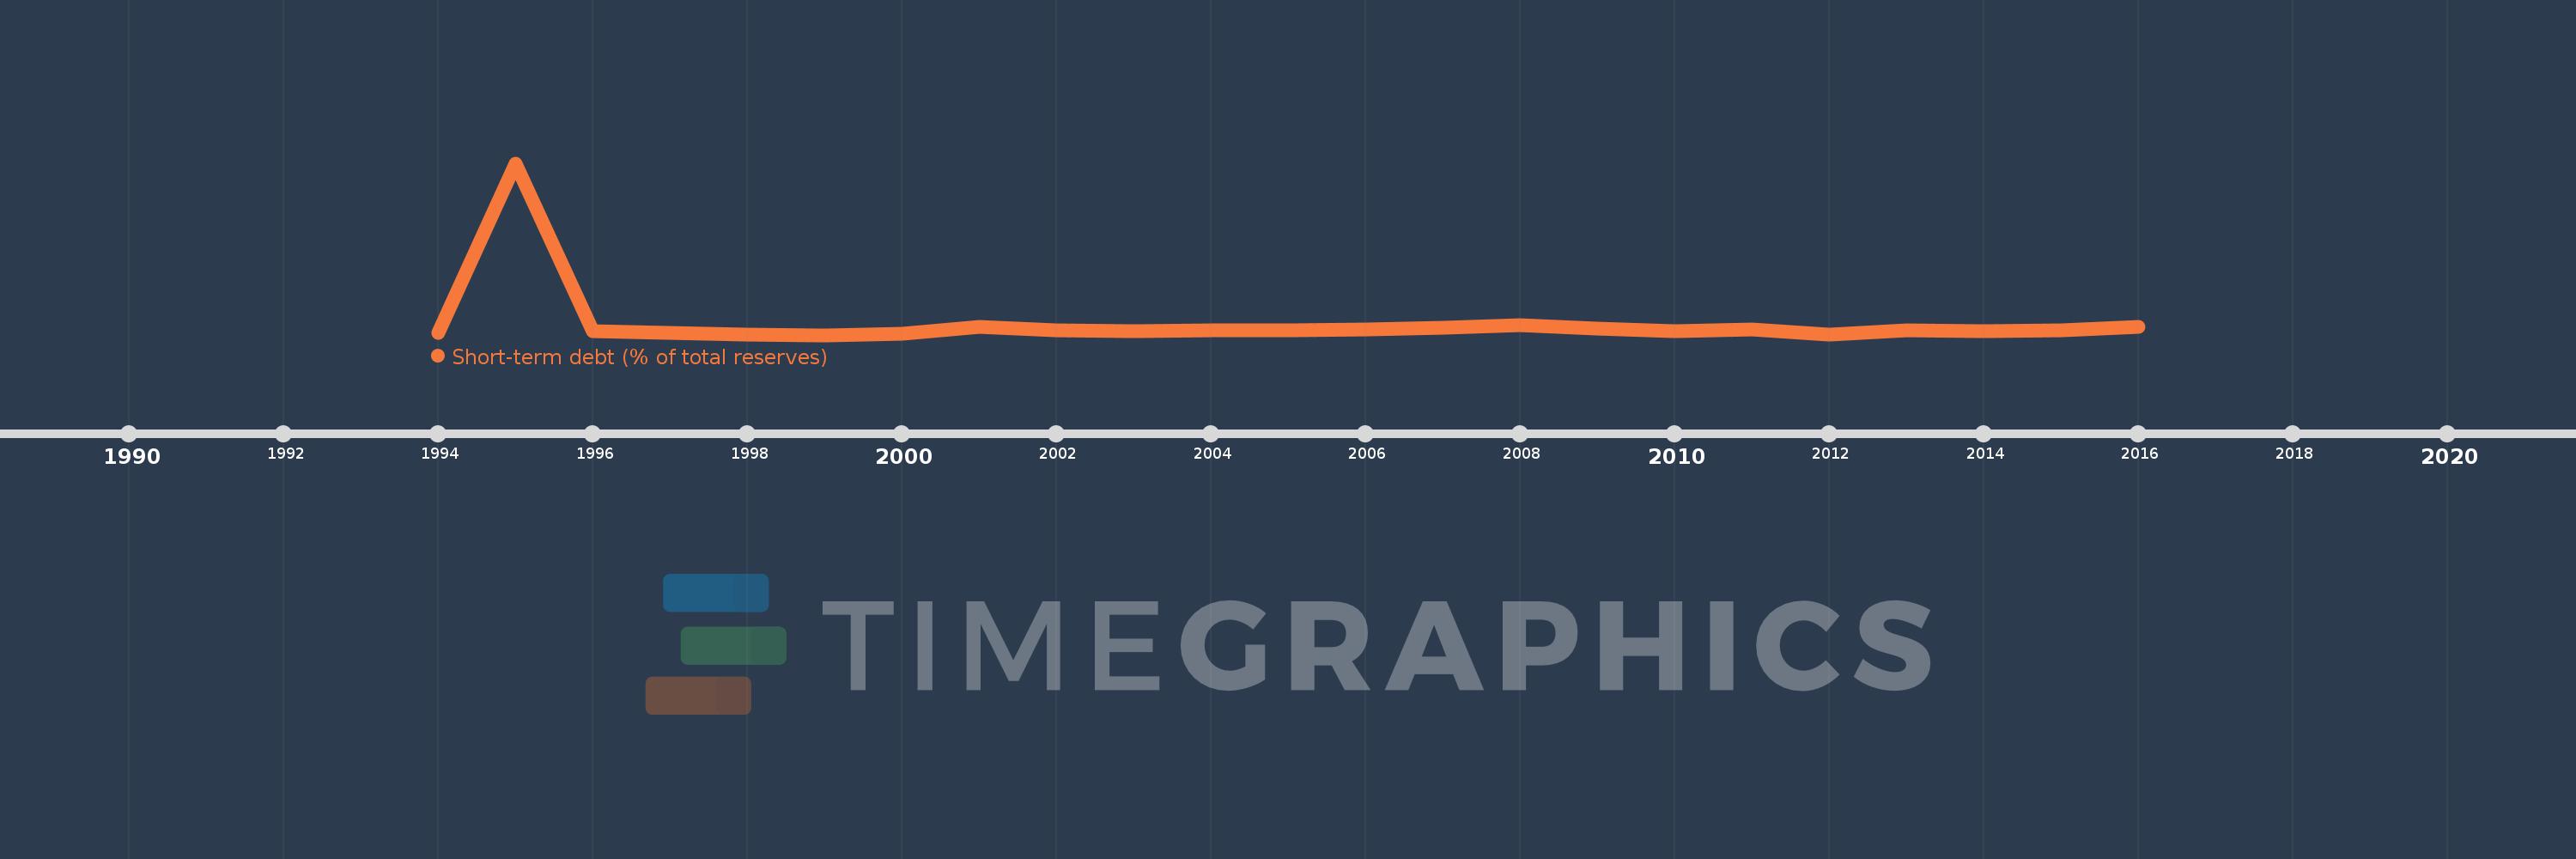
Short-term debt (% of total reserves)
2016,2015,2014,2013,2012,2011,2010,2009,2008,2007,2006,2005,2004,2003,2002,2001,2000,1999,1998,1997,1996,1995,1994
This statistics in other country:
Timeline:
This timeline shows a graph from 1994 to 2016 of Azerbaijan. No data until 1993. Number of actual observations by date: 23.
Source name:
World Development Indicators
Source organization:
World Bank, International Debt Statistics.
Categories, topics:
Economy & Growth, External Debt
Last updated:
apr 23, 2017
Indicators value changes by year
Maximum:
472.661
jan 1, 1995
At the date of observation
Value
Absolute change
Change from previous value
jan 1, 1994
6.779
+6.779
0.0%
jan 1, 1995
472.661
+465.882
6.87K%
jan 1, 1996
11.608
-461.053
-97.54%
jan 1, 1997
7.246
-4.362
-37.58%
jan 1, 1998
0.856
-6.39
-88.19%
jan 1, 1999
0.33
-0.526
-61.45%
jan 1, 2000
4.312
+3.982
1.21K%
jan 1, 2001
22.985
+18.674
433.09%
jan 1, 2002
14.188
-8.797
-38.27%
jan 1, 2003
11.434
-2.754
-19.41%
jan 1, 2004
12.829
+1.395
12.2%
jan 1, 2005
12.836
+0.007
0.05%
jan 1, 2006
15.793
+2.957
23.03%
jan 1, 2007
20.797
+5.004
31.69%
jan 1, 2008
26.491
+5.694
27.38%
jan 1, 2009
17.565
-8.926
-33.69%
jan 1, 2010
11.093
-6.473
-36.85%
jan 1, 2011
15.587
+4.495
40.52%
jan 1, 2012
0.886
-14.702
-94.32%
jan 1, 2013
14.464
+13.578
1.53K%
jan 1, 2014
10.575
-3.888
-26.88%
jan 1, 2015
12.776
+2.201
20.81%
jan 1, 2016
22.553
+9.776
76.52%
Ranking of countries by current statistics by years


Comments: