29
/
en
AIzaSyAYiBZKx7MnpbEhh9jyipgxe19OcubqV5w
April 1, 2024
78971
Bangladesh
BGD
true
2
1
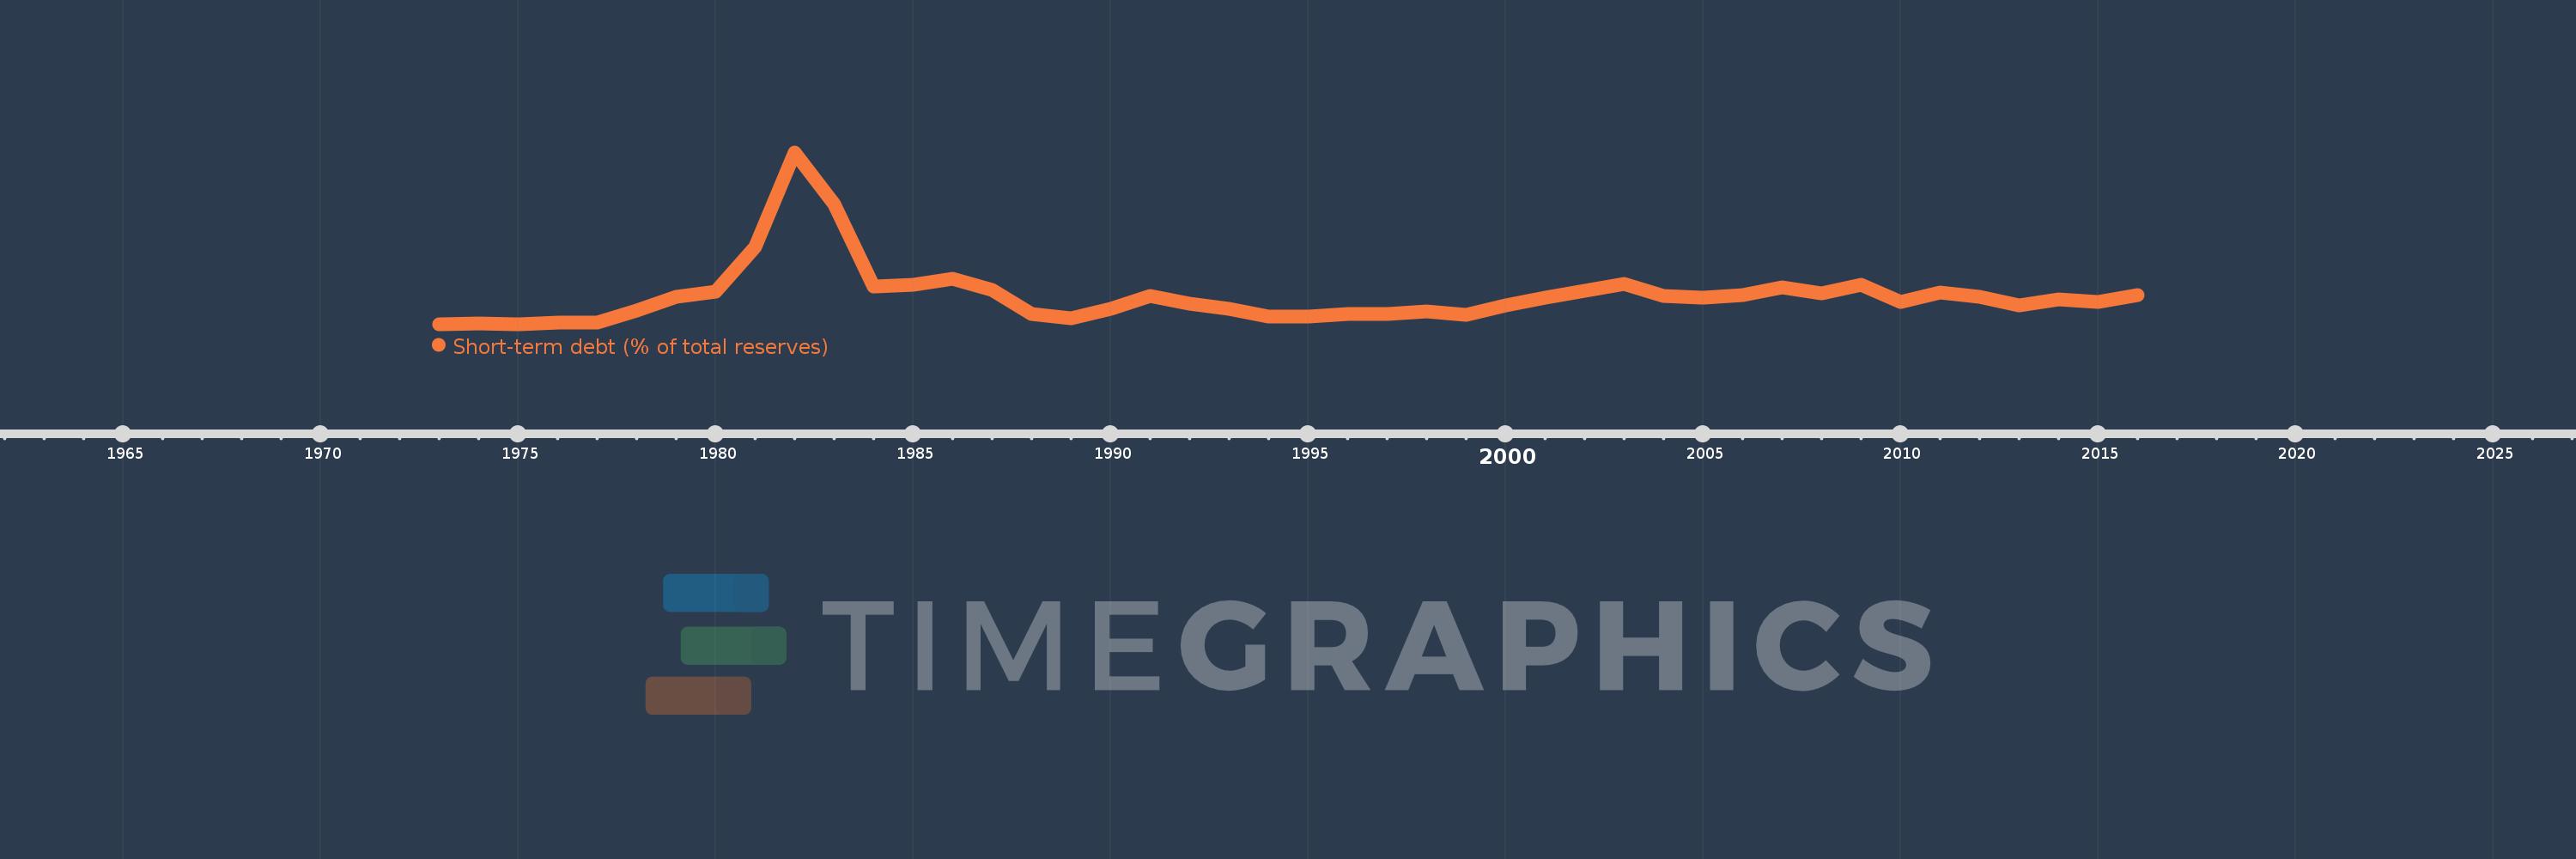
Short-term debt (% of total reserves)
2016,2015,2014,2013,2012,2011,2010,2009,2008,2007,2006,2005,2004,2003,2002,2001,2000,1999,1998,1997,1996,1995,1994,1993,1992,1991,1990,1989,1988,1987,1986,1985,1984,1983,1982,1981,1980,1979,1978,1977,1976,1975,1974,1973
This statistics in other country:
Timeline:
This timeline shows a graph from 1973 to 2016 of Bangladesh. No data until 1972. Number of actual observations by date: 44.
Source name:
World Development Indicators
Source organization:
World Bank, International Debt Statistics.
Categories, topics:
Economy & Growth, External Debt
Last updated:
apr 23, 2017
Indicators value changes by year
Maximum:
142.811
jan 1, 1982
At the date of observation
Value
Absolute change
Change from previous value
jan 1, 1975
0.033
-0.337
-91.01%
jan 1, 1976
1.366
+1.333
4.0K%
jan 1, 1977
1.112
-0.254
-18.6%
jan 1, 1978
11.199
+10.087
907.36%
jan 1, 1979
22.537
+11.337
101.23%
jan 1, 1980
26.871
+4.334
19.23%
jan 1, 1981
64.026
+37.155
138.27%
jan 1, 1982
142.811
+78.785
123.05%
jan 1, 1983
100.247
-42.564
-29.8%
jan 1, 1984
31.151
-69.096
-68.93%
jan 1, 1985
32.601
+1.45
4.66%
jan 1, 1986
37.915
+5.314
16.3%
jan 1, 1987
28.759
-9.156
-24.15%
jan 1, 1988
8.449
-20.31
-70.62%
jan 1, 1989
4.626
-3.823
-45.25%
jan 1, 1990
12.692
+8.066
174.38%
jan 1, 1991
23.642
+10.95
86.28%
jan 1, 1992
16.711
-6.931
-29.32%
jan 1, 1993
12.554
-4.157
-24.87%
jan 1, 1994
6.247
-6.307
-50.24%
jan 1, 1995
6.128
-0.12
-1.91%
jan 1, 1996
8.383
+2.256
36.81%
jan 1, 1997
8.722
+0.339
4.05%
jan 1, 1998
10.864
+2.142
24.56%
jan 1, 1999
7.734
-3.13
-28.81%
jan 1, 2000
15.559
+7.824
101.16%
jan 1, 2001
22.035
+6.476
41.62%
jan 1, 2002
27.63
+5.595
25.39%
jan 1, 2003
33.228
+5.598
20.26%
jan 1, 2004
23.508
-9.72
-29.25%
jan 1, 2005
22.1
-1.408
-5.99%
jan 1, 2006
24.369
+2.269
10.27%
jan 1, 2007
30.383
+6.014
24.68%
jan 1, 2008
25.953
-4.43
-14.58%
jan 1, 2009
32.732
+6.779
26.12%
jan 1, 2010
18.703
-14.029
-42.86%
jan 1, 2011
26.392
+7.688
41.11%
jan 1, 2012
22.947
-3.445
-13.05%
jan 1, 2013
15.361
-7.586
-33.06%
jan 1, 2014
20.649
+5.287
34.42%
jan 1, 2015
18.607
-2.042
-9.89%
jan 1, 2016
24.125
+5.518
29.66%
Ranking of countries by current statistics by years


Comments: