29
/
en
AIzaSyAYiBZKx7MnpbEhh9jyipgxe19OcubqV5w
April 1, 2024
165563
Jordan
JOR
true
2
1
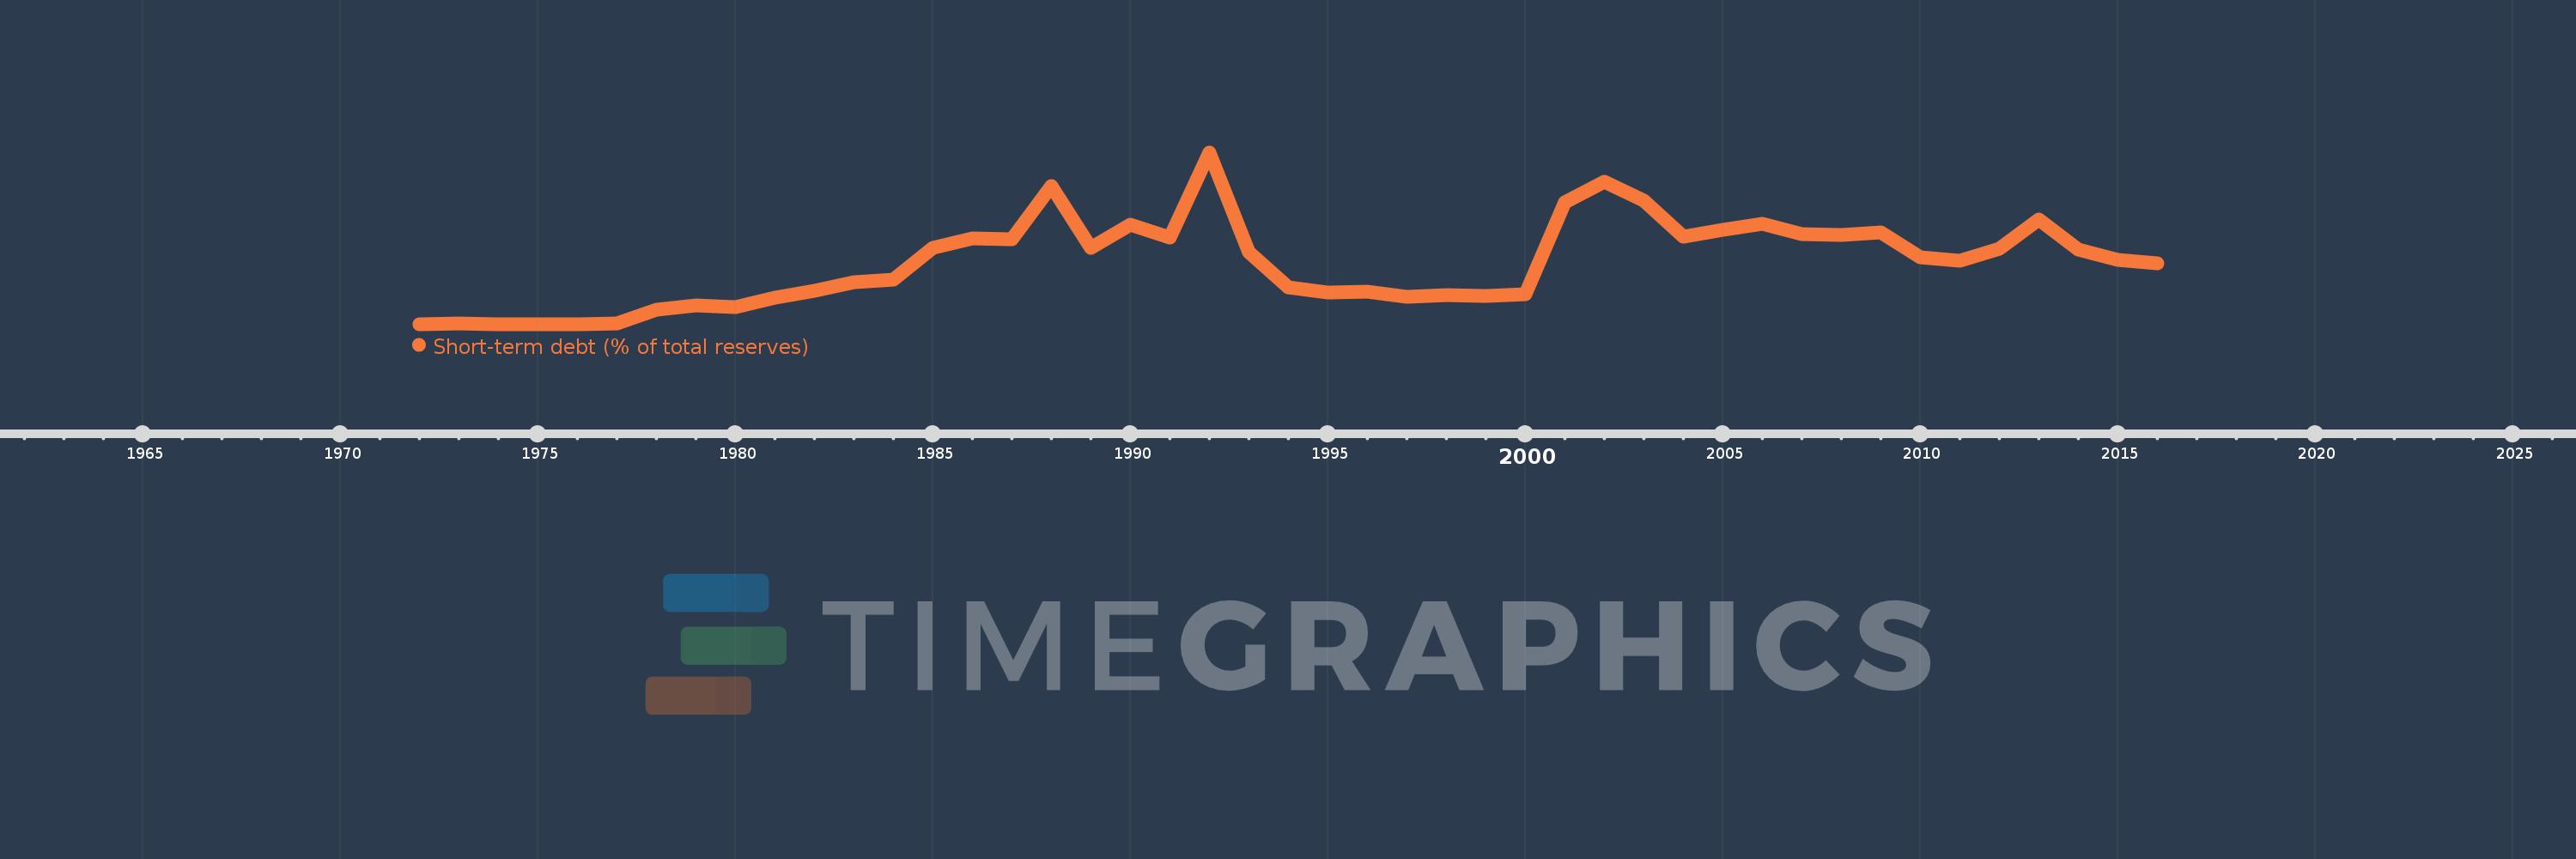
Short-term debt (% of total reserves)
2016,2015,2014,2013,2012,2011,2010,2009,2008,2007,2006,2005,2004,2003,2002,2001,2000,1999,1998,1997,1996,1995,1994,1993,1992,1991,1990,1989,1988,1987,1986,1985,1984,1983,1982,1981,1980,1979,1978,1977,1976,1975,1974,1973,1972
This statistics in other country:
Timeline:
This timeline shows a graph from 1972 to 2016 of Jordan. No data until 1971. Number of actual observations by date: 45.
Source name:
World Development Indicators
Source organization:
World Bank, International Debt Statistics.
Categories, topics:
Economy & Growth, External Debt
Last updated:
apr 23, 2017
Indicators value changes by year
Maximum:
180.312
jan 1, 1992
At the date of observation
Value
Absolute change
Change from previous value
jan 1, 1972
0.467
+0.467
0.0%
jan 1, 1973
0.613
+0.145
31.12%
jan 1, 1974
0.202
-0.411
-67.01%
jan 1, 1975
0.311
+0.109
53.97%
jan 1, 1976
0.367
+0.056
17.91%
jan 1, 1977
0.605
+0.238
64.97%
jan 1, 1978
14.994
+14.389
2.38K%
jan 1, 1979
19.601
+4.607
30.73%
jan 1, 1980
18.262
-1.34
-6.83%
jan 1, 1981
27.819
+9.557
52.33%
jan 1, 1982
34.968
+7.149
25.7%
jan 1, 1983
44.147
+9.18
26.25%
jan 1, 1984
46.534
+2.386
5.41%
jan 1, 1985
80.288
+33.754
72.54%
jan 1, 1986
89.841
+9.553
11.9%
jan 1, 1987
89.51
-0.331
-0.37%
jan 1, 1988
145.213
+55.703
62.23%
jan 1, 1989
79.843
-65.37
-45.02%
jan 1, 1990
104.163
+24.32
30.46%
jan 1, 1991
91.052
-13.111
-12.59%
jan 1, 1992
180.312
+89.26
98.03%
jan 1, 1993
75.462
-104.849
-58.15%
jan 1, 1994
38.59
-36.872
-48.86%
jan 1, 1995
33.765
-4.825
-12.5%
jan 1, 1996
34.431
+0.666
1.97%
jan 1, 1997
28.82
-5.612
-16.3%
jan 1, 1998
30.512
+1.693
5.87%
jan 1, 1999
29.836
-0.676
-2.21%
jan 1, 2000
31.44
+1.604
5.38%
jan 1, 2001
127.748
+96.308
306.32%
jan 1, 2002
149.411
+21.662
16.96%
jan 1, 2003
129.369
-20.042
-13.41%
jan 1, 2004
92.259
-37.11
-28.69%
jan 1, 2005
99.282
+7.023
7.61%
jan 1, 2006
105.143
+5.862
5.9%
jan 1, 2007
94.532
-10.612
-10.09%
jan 1, 2008
93.929
-0.603
-0.64%
jan 1, 2009
96.388
+2.459
2.62%
jan 1, 2010
70.193
-26.195
-27.18%
jan 1, 2011
66.374
-3.819
-5.44%
jan 1, 2012
79.324
+12.95
19.51%
jan 1, 2013
110.262
+30.937
39.0%
jan 1, 2014
78.643
-31.619
-28.68%
jan 1, 2015
67.847
-10.796
-13.73%
jan 1, 2016
63.997
-3.85
-5.68%
Ranking of countries by current statistics by years


Comments: