29
/
en
AIzaSyAYiBZKx7MnpbEhh9jyipgxe19OcubqV5w
April 1, 2024
61518
Upper middle income
UMC
false
2
1
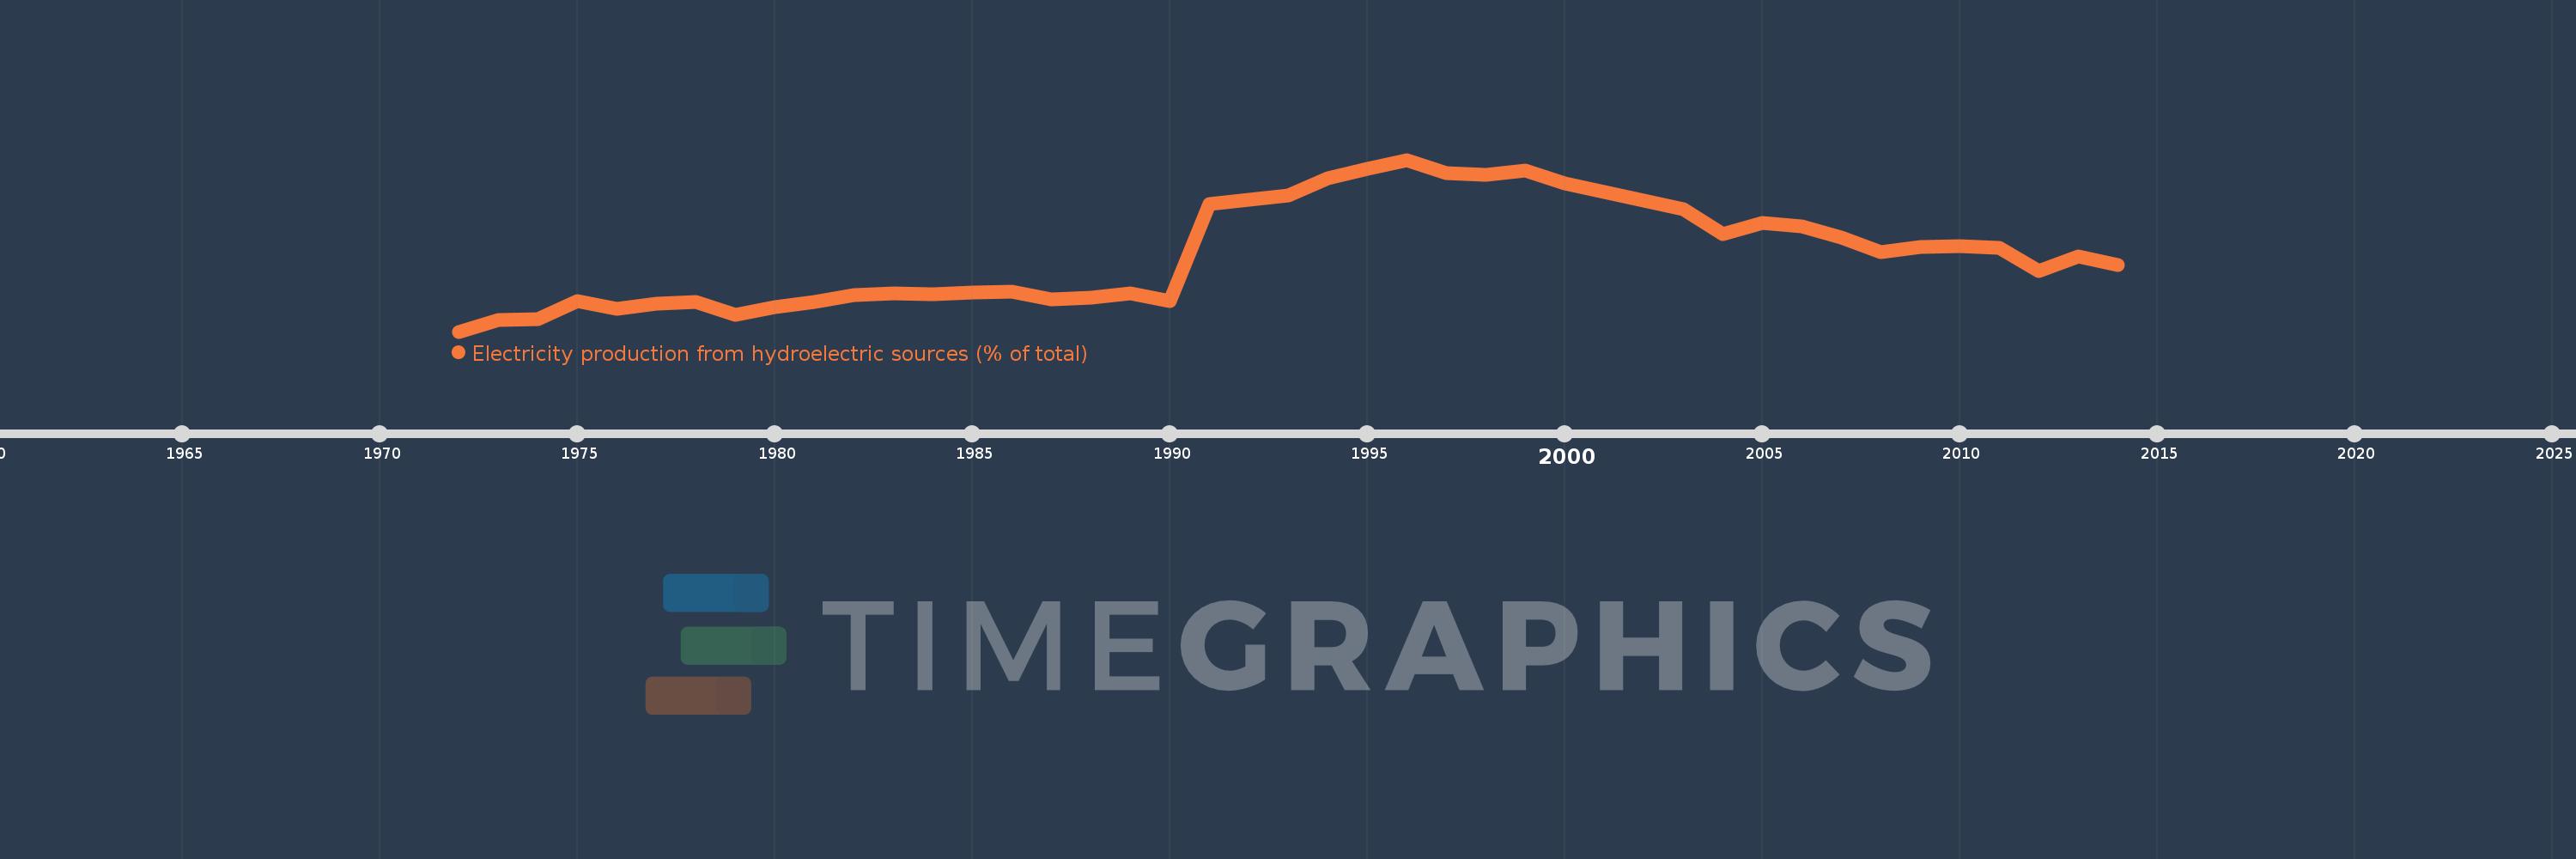
Electricity production from hydroelectric sources (% of total)
2014,2013,2012,2011,2010,2009,2008,2007,2006,2005,2004,2003,2002,2001,2000,1999,1998,1997,1996,1995,1994,1993,1992,1991,1990,1989,1988,1987,1986,1985,1984,1983,1982,1981,1980,1979,1978,1977,1976,1975,1974,1973,1972
This statistics in other country:
AlbaniaAlgeriaAngolaArab WorldArgentinaArmeniaAustraliaAustriaAzerbaijanBahrainBangladeshBelarusBelgiumBeninBoliviaBosnia and HerzegovinaBotswanaBrazilBrunei DarussalamBulgariaCambodiaCameroonCanadaCentral Europe and the BalticsChileChinaColombiaCongo, Dem. Rep.Congo, Rep.Costa RicaCote d'IvoireCroatiaCubaCuracaoCyprusCzech RepublicDenmarkDominican RepublicEarly-demographic dividendEast Asia & PacificEast Asia & Pacific (excluding high income)East Asia & Pacific (IDA & IBRD countries)EcuadorEgypt, Arab Rep.El SalvadorEritreaEstoniaEthiopiaEuro areaEurope & Central AsiaEurope & Central Asia (excluding high income)Europe & Central Asia (IDA & IBRD countries)European UnionFinlandFragile and conflict affected situationsFranceGabonGeorgiaGermanyGhanaGibraltarGreeceGuatemalaHaitiHeavily indebted poor countries (HIPC)High incomeHondurasHong Kong SAR, ChinaHungaryIBRD onlyIcelandIDA & IBRD totalIDA blendIDA onlyIDA totalIndiaIndonesiaIran, Islamic Rep.IraqIrelandIsraelItalyJamaicaJapanJordanKazakhstanKenyaKorea, Dem. People’s Rep.Korea, Rep.KosovoKuwaitKyrgyz RepublicLate-demographic dividendLatin America & Caribbean Latin America & Caribbean (excluding high income)Latin America & the Caribbean (IDA & IBRD countries)LatviaLeast developed countries: UN classificationLebanonLibyaLithuaniaLow & middle incomeLower middle incomeLuxembourgMacedonia, FYRMalaysiaMaltaMauritiusMexicoMiddle East & North AfricaMiddle East & North Africa (excluding high income)Middle East & North Africa (IDA & IBRD countries)Middle incomeMoldovaMongoliaMontenegroMoroccoMozambiqueMyanmarNamibiaNepalNetherlandsNew ZealandNicaraguaNigerNigeriaNorth AmericaNorwayOECD membersOmanOther small statesPakistanPanamaParaguayPeruPhilippinesPolandPortugalPost-demographic dividendPre-demographic dividendQatarRomaniaRussian FederationSaudi ArabiaSenegalSerbiaSingaporeSlovak RepublicSloveniaSmall statesSouth AfricaSouth AsiaSouth Asia (IDA & IBRD)South SudanSpainSri LankaSub-Saharan Africa Sub-Saharan Africa (excluding high income)Sub-Saharan Africa (IDA & IBRD countries)SudanSwedenSwitzerlandSyrian Arab RepublicTajikistanTanzaniaThailandTogoTrinidad and TobagoTunisiaTurkeyTurkmenistanUkraineUnited Arab EmiratesUnited KingdomUnited StatesUpper middle incomeUruguayUzbekistanVenezuela, RBVietnamWorldYemen, Rep.ZambiaZimbabwe Timeline:
This timeline shows a graph from 1972 to 2014 of Upper middle income. No data until 1971. Number of actual observations by date: 43.
Source name:
World Development Indicators
Source organization:
IEA Statistics © OECD/IEA 2014 (http://www.iea.org/stats/index.asp), subject to https://www.iea.org/t&c/termsandconditions/
Categories, topics:
Energy & Mining, Climate Change, Infrastructure
Last updated:
apr 23, 2017
Indicators value changes by year
Minimum:
16.105
jan 1, 1972
Maximum:
27.495
jan 1, 1996
At the date of observation
Value
Absolute change
Change from previous value
jan 1, 1972
16.105
+16.105
0.0%
jan 1, 1973
16.876
+0.771
4.79%
jan 1, 1974
16.957
+0.081
0.48%
jan 1, 1975
18.133
+1.176
6.93%
jan 1, 1976
17.615
-0.518
-2.86%
jan 1, 1977
17.954
+0.339
1.93%
jan 1, 1978
18.087
+0.133
0.74%
jan 1, 1979
17.221
-0.866
-4.79%
jan 1, 1980
17.723
+0.502
2.91%
jan 1, 1981
18.081
+0.359
2.02%
jan 1, 1982
18.548
+0.467
2.58%
jan 1, 1983
18.662
+0.114
0.62%
jan 1, 1984
18.57
-0.092
-0.5%
jan 1, 1985
18.685
+0.115
0.62%
jan 1, 1986
18.74
+0.055
0.3%
jan 1, 1987
18.264
-0.476
-2.54%
jan 1, 1988
18.344
+0.079
0.43%
jan 1, 1989
18.633
+0.289
1.58%
jan 1, 1990
18.122
-0.511
-2.74%
jan 1, 1991
24.582
+6.46
35.65%
jan 1, 1992
24.869
+0.286
1.17%
jan 1, 1993
25.11
+0.241
0.97%
jan 1, 1994
26.282
+1.172
4.67%
jan 1, 1995
26.875
+0.594
2.26%
jan 1, 1996
27.495
+0.62
2.31%
jan 1, 1997
26.608
-0.887
-3.23%
jan 1, 1998
26.506
-0.102
-0.38%
jan 1, 1999
26.761
+0.255
0.96%
jan 1, 2000
25.951
-0.81
-3.03%
jan 1, 2001
25.349
-0.602
-2.32%
jan 1, 2002
24.767
-0.582
-2.29%
jan 1, 2003
24.215
-0.552
-2.23%
jan 1, 2004
22.545
-1.67
-6.9%
jan 1, 2005
23.286
+0.741
3.29%
jan 1, 2006
23.078
-0.208
-0.9%
jan 1, 2007
22.365
-0.713
-3.09%
jan 1, 2008
21.389
-0.975
-4.36%
jan 1, 2009
21.706
+0.317
1.48%
jan 1, 2010
21.75
+0.044
0.2%
jan 1, 2011
21.652
-0.098
-0.45%
jan 1, 2012
20.148
-1.504
-6.95%
jan 1, 2013
21.09
+0.942
4.68%
jan 1, 2014
20.495
-0.595
-2.82%
Ranking of countries by current statistics by years


Comments: