29
/
en
AIzaSyAYiBZKx7MnpbEhh9jyipgxe19OcubqV5w
April 1, 2024
160378
Israel
ISR
true
2
1
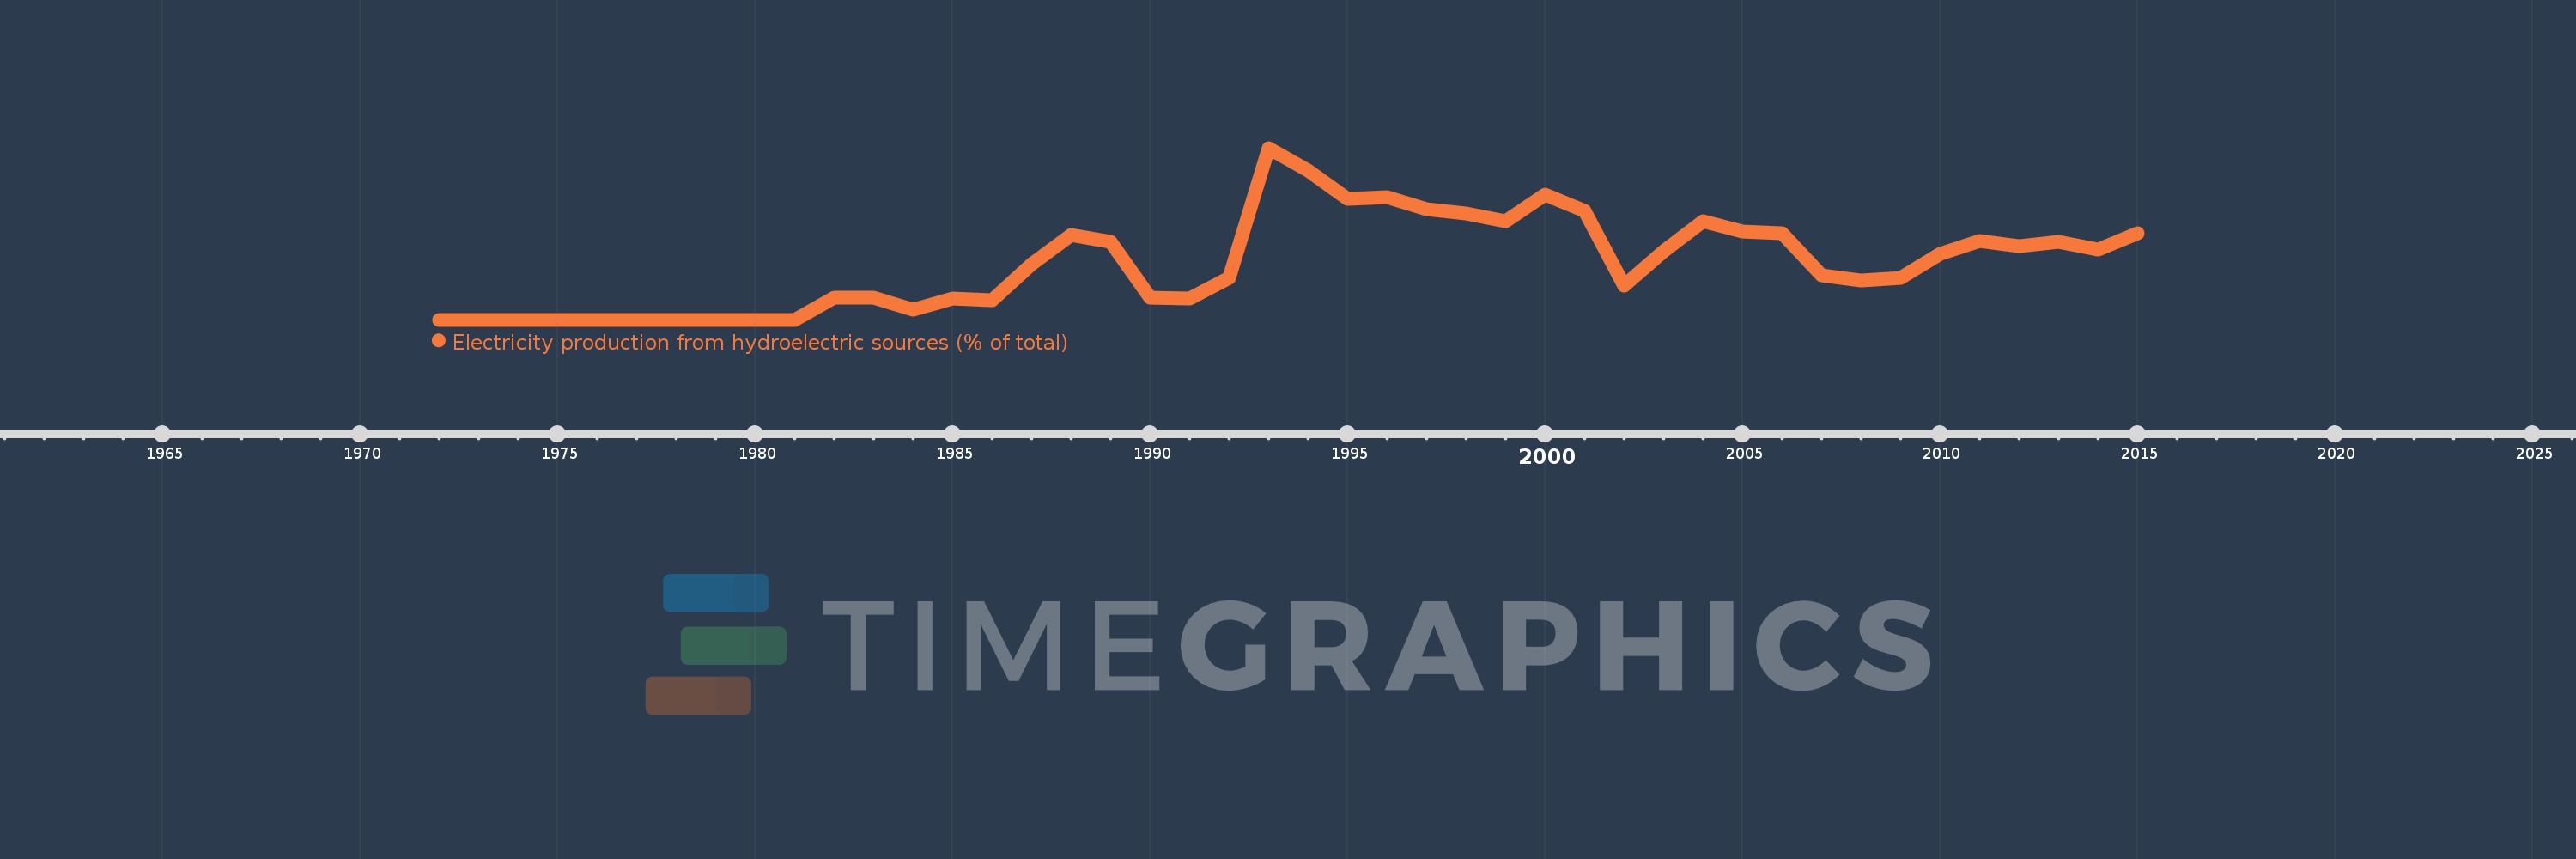
Electricity production from hydroelectric sources (% of total)
2015,2014,2013,2012,2011,2010,2009,2008,2007,2006,2005,2004,2003,2002,2001,2000,1999,1998,1997,1996,1995,1994,1993,1992,1991,1990,1989,1988,1987,1986,1985,1984,1983,1982,1981,1980,1979,1978,1977,1976,1975,1974,1973,1972
This statistics in other country:
AlbaniaAlgeriaAngolaArab WorldArgentinaArmeniaAustraliaAustriaAzerbaijanBahrainBangladeshBelarusBelgiumBeninBoliviaBosnia and HerzegovinaBotswanaBrazilBrunei DarussalamBulgariaCambodiaCameroonCanadaCentral Europe and the BalticsChileChinaColombiaCongo, Dem. Rep.Congo, Rep.Costa RicaCote d'IvoireCroatiaCubaCuracaoCyprusCzech RepublicDenmarkDominican RepublicEarly-demographic dividendEast Asia & PacificEast Asia & Pacific (excluding high income)East Asia & Pacific (IDA & IBRD countries)EcuadorEgypt, Arab Rep.El SalvadorEritreaEstoniaEthiopiaEuro areaEurope & Central AsiaEurope & Central Asia (excluding high income)Europe & Central Asia (IDA & IBRD countries)European UnionFinlandFragile and conflict affected situationsFranceGabonGeorgiaGermanyGhanaGibraltarGreeceGuatemalaHaitiHeavily indebted poor countries (HIPC)High incomeHondurasHong Kong SAR, ChinaHungaryIBRD onlyIcelandIDA & IBRD totalIDA blendIDA onlyIDA totalIndiaIndonesiaIran, Islamic Rep.IraqIrelandIsraelItalyJamaicaJapanJordanKazakhstanKenyaKorea, Dem. People’s Rep.Korea, Rep.KosovoKuwaitKyrgyz RepublicLate-demographic dividendLatin America & Caribbean Latin America & Caribbean (excluding high income)Latin America & the Caribbean (IDA & IBRD countries)LatviaLeast developed countries: UN classificationLebanonLibyaLithuaniaLow & middle incomeLower middle incomeLuxembourgMacedonia, FYRMalaysiaMaltaMauritiusMexicoMiddle East & North AfricaMiddle East & North Africa (excluding high income)Middle East & North Africa (IDA & IBRD countries)Middle incomeMoldovaMongoliaMontenegroMoroccoMozambiqueMyanmarNamibiaNepalNetherlandsNew ZealandNicaraguaNigerNigeriaNorth AmericaNorwayOECD membersOmanOther small statesPakistanPanamaParaguayPeruPhilippinesPolandPortugalPost-demographic dividendPre-demographic dividendQatarRomaniaRussian FederationSaudi ArabiaSenegalSerbiaSingaporeSlovak RepublicSloveniaSmall statesSouth AfricaSouth AsiaSouth Asia (IDA & IBRD)South SudanSpainSri LankaSub-Saharan Africa Sub-Saharan Africa (excluding high income)Sub-Saharan Africa (IDA & IBRD countries)SudanSwedenSwitzerlandSyrian Arab RepublicTajikistanTanzaniaThailandTogoTrinidad and TobagoTunisiaTurkeyTurkmenistanUkraineUnited Arab EmiratesUnited KingdomUnited StatesUpper middle incomeUruguayUzbekistanVenezuela, RBVietnamWorldYemen, Rep.ZambiaZimbabwe Timeline:
This timeline shows a graph from 1972 to 2015 of Israel. No data until 1971. Number of actual observations by date: 44.
Source name:
World Development Indicators
Source organization:
IEA Statistics © OECD/IEA 2014 (http://www.iea.org/stats/index.asp), subject to https://www.iea.org/t&c/termsandconditions/
Categories, topics:
Energy & Mining, Climate Change, Infrastructure
Last updated:
apr 23, 2017
Indicators value changes by year
At the date of observation
Value
Absolute change
Change from previous value
jan 1, 1982
0.015
+0.015
%
jan 1, 1983
0.015
-0.001
-4.87%
jan 1, 1984
0.007
-0.008
-52.49%
jan 1, 1985
0.014
+0.007
95.77%
jan 1, 1986
0.013
-0.001
-4.97%
jan 1, 1987
0.037
+0.024
188.74%
jan 1, 1988
0.057
+0.019
51.18%
jan 1, 1989
0.052
-0.005
-8.66%
jan 1, 1990
0.015
-0.037
-71.61%
jan 1, 1991
0.014
0.0
-2.13%
jan 1, 1992
0.028
+0.014
94.27%
jan 1, 1993
0.115
+0.087
313.56%
jan 1, 1994
0.1
-0.015
-13.35%
jan 1, 1995
0.081
-0.019
-19.04%
jan 1, 1996
0.082
+0.001
1.55%
jan 1, 1997
0.074
-0.008
-10.21%
jan 1, 1998
0.071
-0.003
-3.46%
jan 1, 1999
0.066
-0.005
-7.52%
jan 1, 2000
0.084
+0.018
27.76%
jan 1, 2001
0.073
-0.011
-13.65%
jan 1, 2002
0.023
-0.05
-68.69%
jan 1, 2003
0.046
+0.023
102.85%
jan 1, 2004
0.066
+0.02
42.78%
jan 1, 2005
0.059
-0.007
-10.13%
jan 1, 2006
0.058
-0.002
-2.72%
jan 1, 2007
0.03
-0.028
-48.5%
jan 1, 2008
0.026
-0.004
-12.28%
jan 1, 2009
0.028
+0.002
7.85%
jan 1, 2010
0.044
+0.016
55.44%
jan 1, 2011
0.053
+0.009
21.27%
jan 1, 2012
0.049
-0.004
-8.16%
jan 1, 2013
0.052
+0.004
7.79%
jan 1, 2014
0.047
-0.006
-10.82%
jan 1, 2015
0.058
+0.011
23.77%
Ranking of countries by current statistics by years


Comments: