29
/
en
AIzaSyAYiBZKx7MnpbEhh9jyipgxe19OcubqV5w
April 1, 2024
202796
Mozambique
MOZ
true
2
1
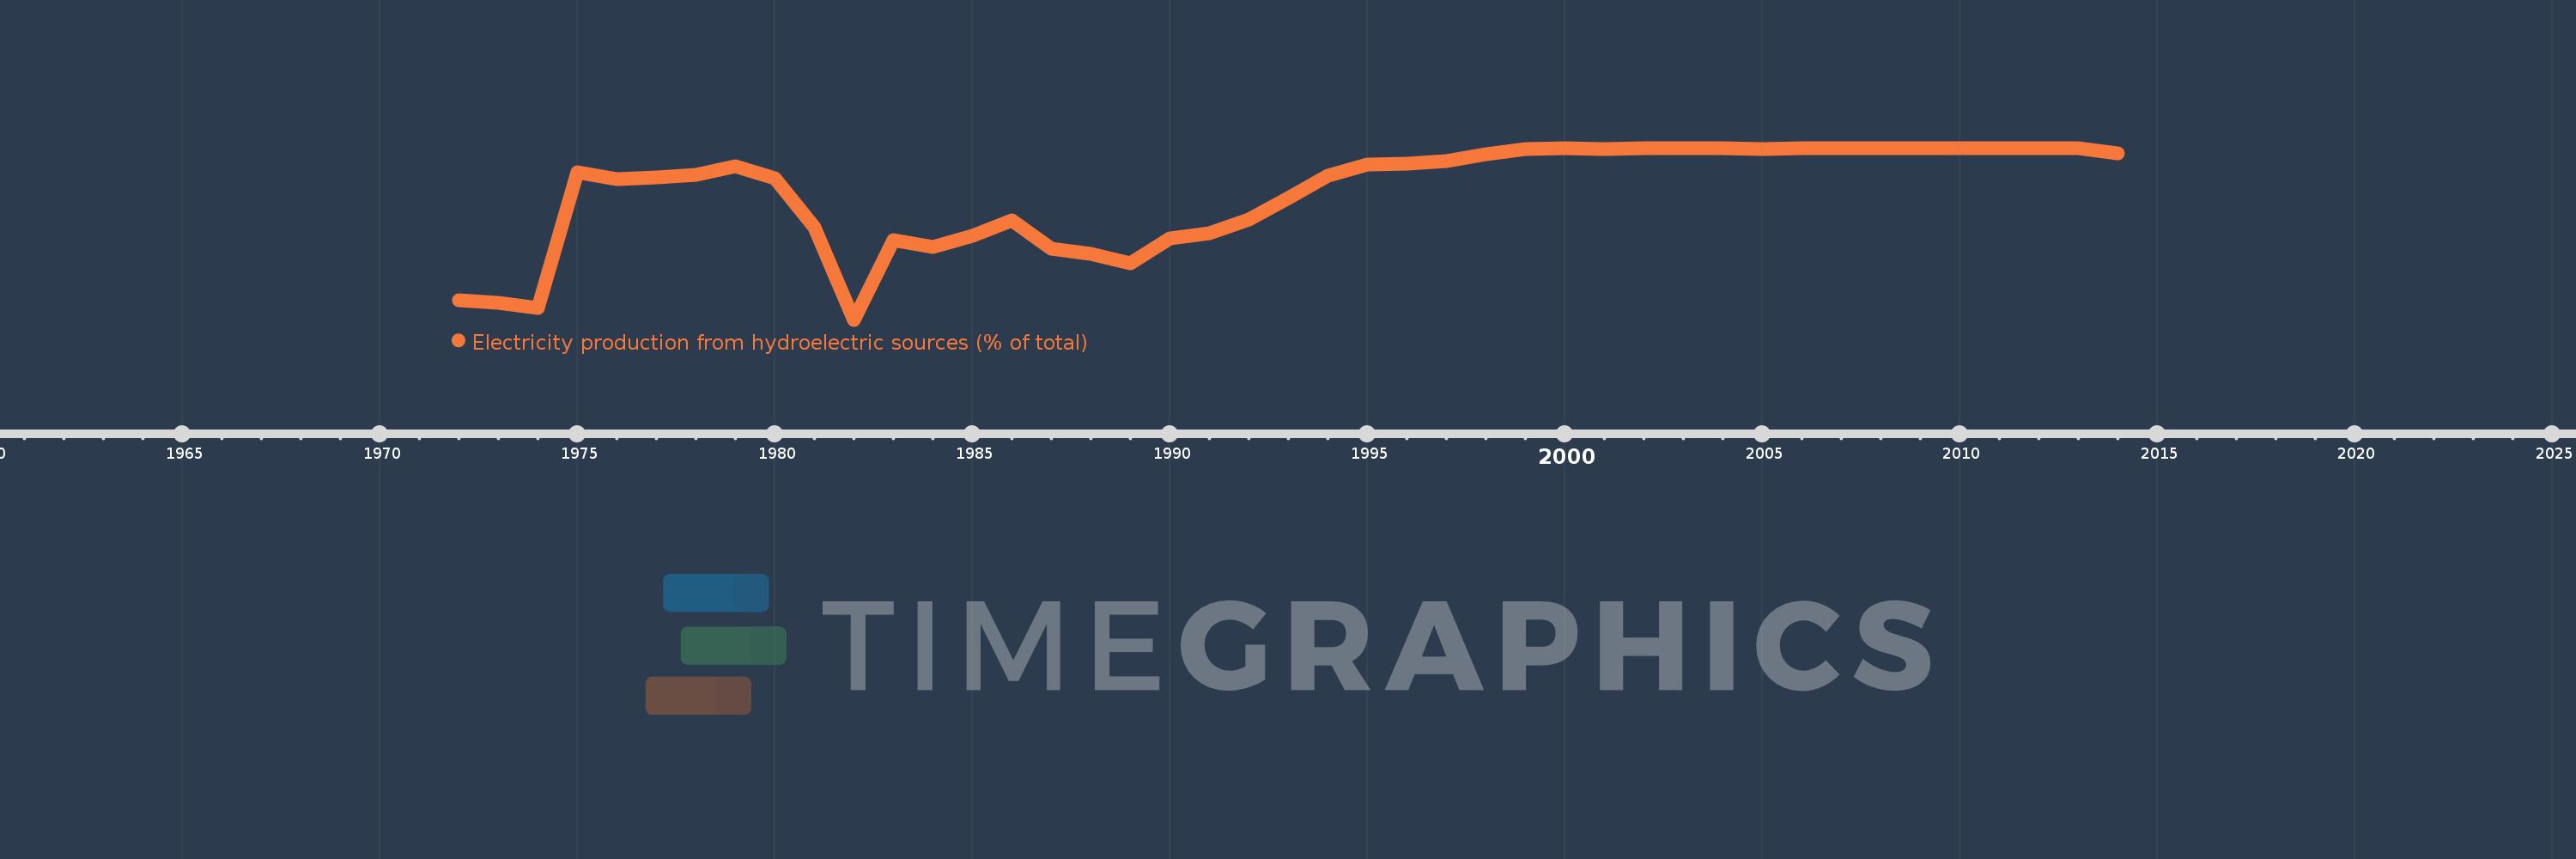
Electricity production from hydroelectric sources (% of total)
2014,2013,2012,2011,2010,2009,2008,2007,2006,2005,2004,2003,2002,2001,2000,1999,1998,1997,1996,1995,1994,1993,1992,1991,1990,1989,1988,1987,1986,1985,1984,1983,1982,1981,1980,1979,1978,1977,1976,1975,1974,1973,1972
This statistics in other country:
AlbaniaAlgeriaAngolaArab WorldArgentinaArmeniaAustraliaAustriaAzerbaijanBahrainBangladeshBelarusBelgiumBeninBoliviaBosnia and HerzegovinaBotswanaBrazilBrunei DarussalamBulgariaCambodiaCameroonCanadaCentral Europe and the BalticsChileChinaColombiaCongo, Dem. Rep.Congo, Rep.Costa RicaCote d'IvoireCroatiaCubaCuracaoCyprusCzech RepublicDenmarkDominican RepublicEarly-demographic dividendEast Asia & PacificEast Asia & Pacific (excluding high income)East Asia & Pacific (IDA & IBRD countries)EcuadorEgypt, Arab Rep.El SalvadorEritreaEstoniaEthiopiaEuro areaEurope & Central AsiaEurope & Central Asia (excluding high income)Europe & Central Asia (IDA & IBRD countries)European UnionFinlandFragile and conflict affected situationsFranceGabonGeorgiaGermanyGhanaGibraltarGreeceGuatemalaHaitiHeavily indebted poor countries (HIPC)High incomeHondurasHong Kong SAR, ChinaHungaryIBRD onlyIcelandIDA & IBRD totalIDA blendIDA onlyIDA totalIndiaIndonesiaIran, Islamic Rep.IraqIrelandIsraelItalyJamaicaJapanJordanKazakhstanKenyaKorea, Dem. People’s Rep.Korea, Rep.KosovoKuwaitKyrgyz RepublicLate-demographic dividendLatin America & Caribbean Latin America & Caribbean (excluding high income)Latin America & the Caribbean (IDA & IBRD countries)LatviaLeast developed countries: UN classificationLebanonLibyaLithuaniaLow & middle incomeLower middle incomeLuxembourgMacedonia, FYRMalaysiaMaltaMauritiusMexicoMiddle East & North AfricaMiddle East & North Africa (excluding high income)Middle East & North Africa (IDA & IBRD countries)Middle incomeMoldovaMongoliaMontenegroMoroccoMozambiqueMyanmarNamibiaNepalNetherlandsNew ZealandNicaraguaNigerNigeriaNorth AmericaNorwayOECD membersOmanOther small statesPakistanPanamaParaguayPeruPhilippinesPolandPortugalPost-demographic dividendPre-demographic dividendQatarRomaniaRussian FederationSaudi ArabiaSenegalSerbiaSingaporeSlovak RepublicSloveniaSmall statesSouth AfricaSouth AsiaSouth Asia (IDA & IBRD)South SudanSpainSri LankaSub-Saharan Africa Sub-Saharan Africa (excluding high income)Sub-Saharan Africa (IDA & IBRD countries)SudanSwedenSwitzerlandSyrian Arab RepublicTajikistanTanzaniaThailandTogoTrinidad and TobagoTunisiaTurkeyTurkmenistanUkraineUnited Arab EmiratesUnited KingdomUnited StatesUpper middle incomeUruguayUzbekistanVenezuela, RBVietnamWorldYemen, Rep.ZambiaZimbabwe Timeline:
This timeline shows a graph from 1972 to 2014 of Mozambique. No data until 1971. Number of actual observations by date: 43.
Source name:
World Development Indicators
Source organization:
IEA Statistics © OECD/IEA 2014 (http://www.iea.org/stats/index.asp), subject to https://www.iea.org/t&c/termsandconditions/
Categories, topics:
Energy & Mining, Climate Change, Infrastructure
Last updated:
apr 23, 2017
Indicators value changes by year
Minimum:
24.569
jan 1, 1982
Maximum:
99.923
jan 1, 2010
At the date of observation
Value
Absolute change
Change from previous value
jan 1, 1972
33.234
+33.234
0.0%
jan 1, 1973
32.127
-1.108
-3.33%
jan 1, 1974
29.797
-2.33
-7.25%
jan 1, 1975
89.424
+59.627
200.11%
jan 1, 1976
86.424
-3.001
-3.36%
jan 1, 1977
87.161
+0.737
0.85%
jan 1, 1978
87.994
+0.833
0.96%
jan 1, 1979
91.781
+3.786
4.3%
jan 1, 1980
86.735
-5.046
-5.5%
jan 1, 1981
65.152
-21.583
-24.88%
jan 1, 1982
24.569
-40.583
-62.29%
jan 1, 1983
59.624
+35.055
142.68%
jan 1, 1984
56.595
-3.03
-5.08%
jan 1, 1985
61.307
+4.712
8.33%
jan 1, 1986
68.182
+6.875
11.21%
jan 1, 1987
55.806
-12.375
-18.15%
jan 1, 1988
53.571
-2.235
-4.0%
jan 1, 1989
49.258
-4.313
-8.05%
jan 1, 1990
60.169
+10.911
22.15%
jan 1, 1991
62.555
+2.386
3.96%
jan 1, 1992
68.577
+6.022
9.63%
jan 1, 1993
78.125
+9.548
13.92%
jan 1, 1994
87.755
+9.63
12.33%
jan 1, 1995
92.658
+4.903
5.59%
jan 1, 1996
92.892
+0.234
0.25%
jan 1, 1997
94.328
+1.436
1.55%
jan 1, 1998
97.214
+2.886
3.06%
jan 1, 1999
99.607
+2.393
2.46%
jan 1, 2000
99.689
+0.082
0.08%
jan 1, 2001
99.546
-0.143
-0.14%
jan 1, 2002
99.63
+0.084
0.08%
jan 1, 2003
99.701
+0.071
0.07%
jan 1, 2004
99.661
-0.04
-0.04%
jan 1, 2005
99.607
-0.053
-0.05%
jan 1, 2006
99.842
+0.235
0.24%
jan 1, 2007
99.864
+0.022
0.02%
jan 1, 2008
99.919
+0.055
0.05%
jan 1, 2009
99.914
-0.005
-0.01%
jan 1, 2010
99.923
+0.009
0.01%
jan 1, 2011
99.886
-0.037
-0.04%
jan 1, 2012
99.881
-0.005
0.0%
jan 1, 2013
99.862
-0.02
-0.02%
jan 1, 2014
97.657
-2.205
-2.21%
Ranking of countries by current statistics by years


Comments: