29
/
en
AIzaSyAYiBZKx7MnpbEhh9jyipgxe19OcubqV5w
April 1, 2024
175215
Latvia
LVA
true
2
1
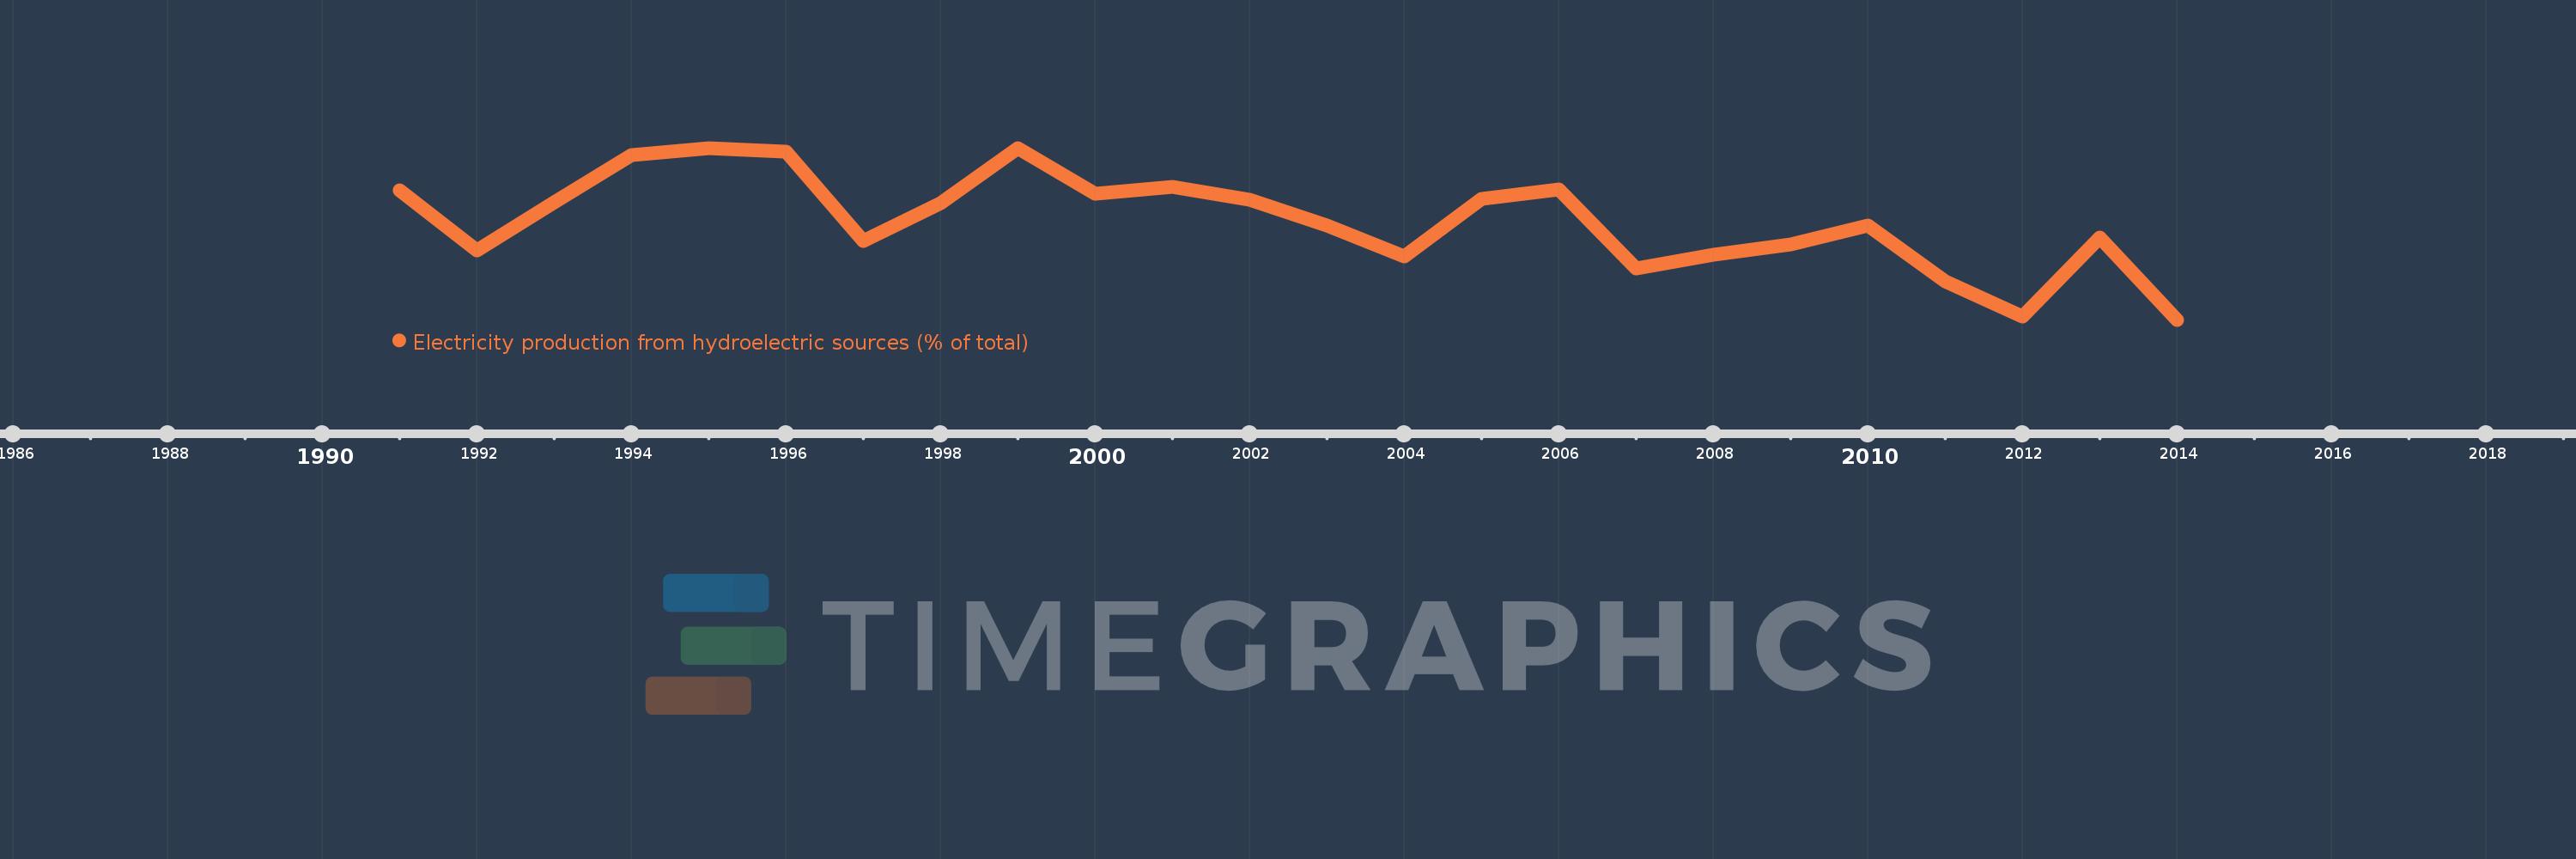
Electricity production from hydroelectric sources (% of total)
2014,2013,2012,2011,2010,2009,2008,2007,2006,2005,2004,2003,2002,2001,2000,1999,1998,1997,1996,1995,1994,1993,1992,1991
This statistics in other country:
AlbaniaAlgeriaAngolaArab WorldArgentinaArmeniaAustraliaAustriaAzerbaijanBahrainBangladeshBelarusBelgiumBeninBoliviaBosnia and HerzegovinaBotswanaBrazilBrunei DarussalamBulgariaCambodiaCameroonCanadaCentral Europe and the BalticsChileChinaColombiaCongo, Dem. Rep.Congo, Rep.Costa RicaCote d'IvoireCroatiaCubaCuracaoCyprusCzech RepublicDenmarkDominican RepublicEarly-demographic dividendEast Asia & PacificEast Asia & Pacific (excluding high income)East Asia & Pacific (IDA & IBRD countries)EcuadorEgypt, Arab Rep.El SalvadorEritreaEstoniaEthiopiaEuro areaEurope & Central AsiaEurope & Central Asia (excluding high income)Europe & Central Asia (IDA & IBRD countries)European UnionFinlandFragile and conflict affected situationsFranceGabonGeorgiaGermanyGhanaGibraltarGreeceGuatemalaHaitiHeavily indebted poor countries (HIPC)High incomeHondurasHong Kong SAR, ChinaHungaryIBRD onlyIcelandIDA & IBRD totalIDA blendIDA onlyIDA totalIndiaIndonesiaIran, Islamic Rep.IraqIrelandIsraelItalyJamaicaJapanJordanKazakhstanKenyaKorea, Dem. People’s Rep.Korea, Rep.KosovoKuwaitKyrgyz RepublicLate-demographic dividendLatin America & Caribbean Latin America & Caribbean (excluding high income)Latin America & the Caribbean (IDA & IBRD countries)LatviaLeast developed countries: UN classificationLebanonLibyaLithuaniaLow & middle incomeLower middle incomeLuxembourgMacedonia, FYRMalaysiaMaltaMauritiusMexicoMiddle East & North AfricaMiddle East & North Africa (excluding high income)Middle East & North Africa (IDA & IBRD countries)Middle incomeMoldovaMongoliaMontenegroMoroccoMozambiqueMyanmarNamibiaNepalNetherlandsNew ZealandNicaraguaNigerNigeriaNorth AmericaNorwayOECD membersOmanOther small statesPakistanPanamaParaguayPeruPhilippinesPolandPortugalPost-demographic dividendPre-demographic dividendQatarRomaniaRussian FederationSaudi ArabiaSenegalSerbiaSingaporeSlovak RepublicSloveniaSmall statesSouth AfricaSouth AsiaSouth Asia (IDA & IBRD)South SudanSpainSri LankaSub-Saharan Africa Sub-Saharan Africa (excluding high income)Sub-Saharan Africa (IDA & IBRD countries)SudanSwedenSwitzerlandSyrian Arab RepublicTajikistanTanzaniaThailandTogoTrinidad and TobagoTunisiaTurkeyTurkmenistanUkraineUnited Arab EmiratesUnited KingdomUnited StatesUpper middle incomeUruguayUzbekistanVenezuela, RBVietnamWorldYemen, Rep.ZambiaZimbabwe Timeline:
This timeline shows a graph from 1991 to 2014 of Latvia. No data until 1990. Number of actual observations by date: 24.
Source name:
World Development Indicators
Source organization:
IEA Statistics © OECD/IEA 2014 (http://www.iea.org/stats/index.asp), subject to https://www.iea.org/t&c/termsandconditions/
Categories, topics:
Energy & Mining, Climate Change, Infrastructure
Last updated:
apr 23, 2017
Indicators value changes by year
Maximum:
74.452
jan 1, 1999
At the date of observation
Value
Absolute change
Change from previous value
jan 1, 1991
67.629
+67.629
0.0%
jan 1, 1992
58.026
-9.603
-14.2%
jan 1, 1993
65.754
+7.728
13.32%
jan 1, 1994
73.293
+7.539
11.47%
jan 1, 1995
74.437
+1.144
1.56%
jan 1, 1996
73.813
-0.624
-0.84%
jan 1, 1997
59.501
-14.312
-19.39%
jan 1, 1998
65.535
+6.034
10.14%
jan 1, 1999
74.452
+8.917
13.61%
jan 1, 2000
67.08
-7.372
-9.9%
jan 1, 2001
68.158
+1.077
1.61%
jan 1, 2002
66.192
-1.966
-2.88%
jan 1, 2003
61.987
-4.204
-6.35%
jan 1, 2004
57.006
-4.981
-8.04%
jan 1, 2005
66.304
+9.298
16.31%
jan 1, 2006
67.795
+1.49
2.25%
jan 1, 2007
55.163
-12.632
-18.63%
jan 1, 2008
57.284
+2.121
3.85%
jan 1, 2009
58.95
+1.666
2.91%
jan 1, 2010
62.076
+3.126
5.3%
jan 1, 2011
53.116
-8.96
-14.43%
jan 1, 2012
47.374
-5.742
-10.81%
jan 1, 2013
60.11
+12.736
26.88%
jan 1, 2014
46.9
-13.211
-21.98%
Ranking of countries by current statistics by years


Comments: