29
/
en
AIzaSyAYiBZKx7MnpbEhh9jyipgxe19OcubqV5w
April 1, 2024
25603
Central Europe and the Baltics
CEB
false
2
1
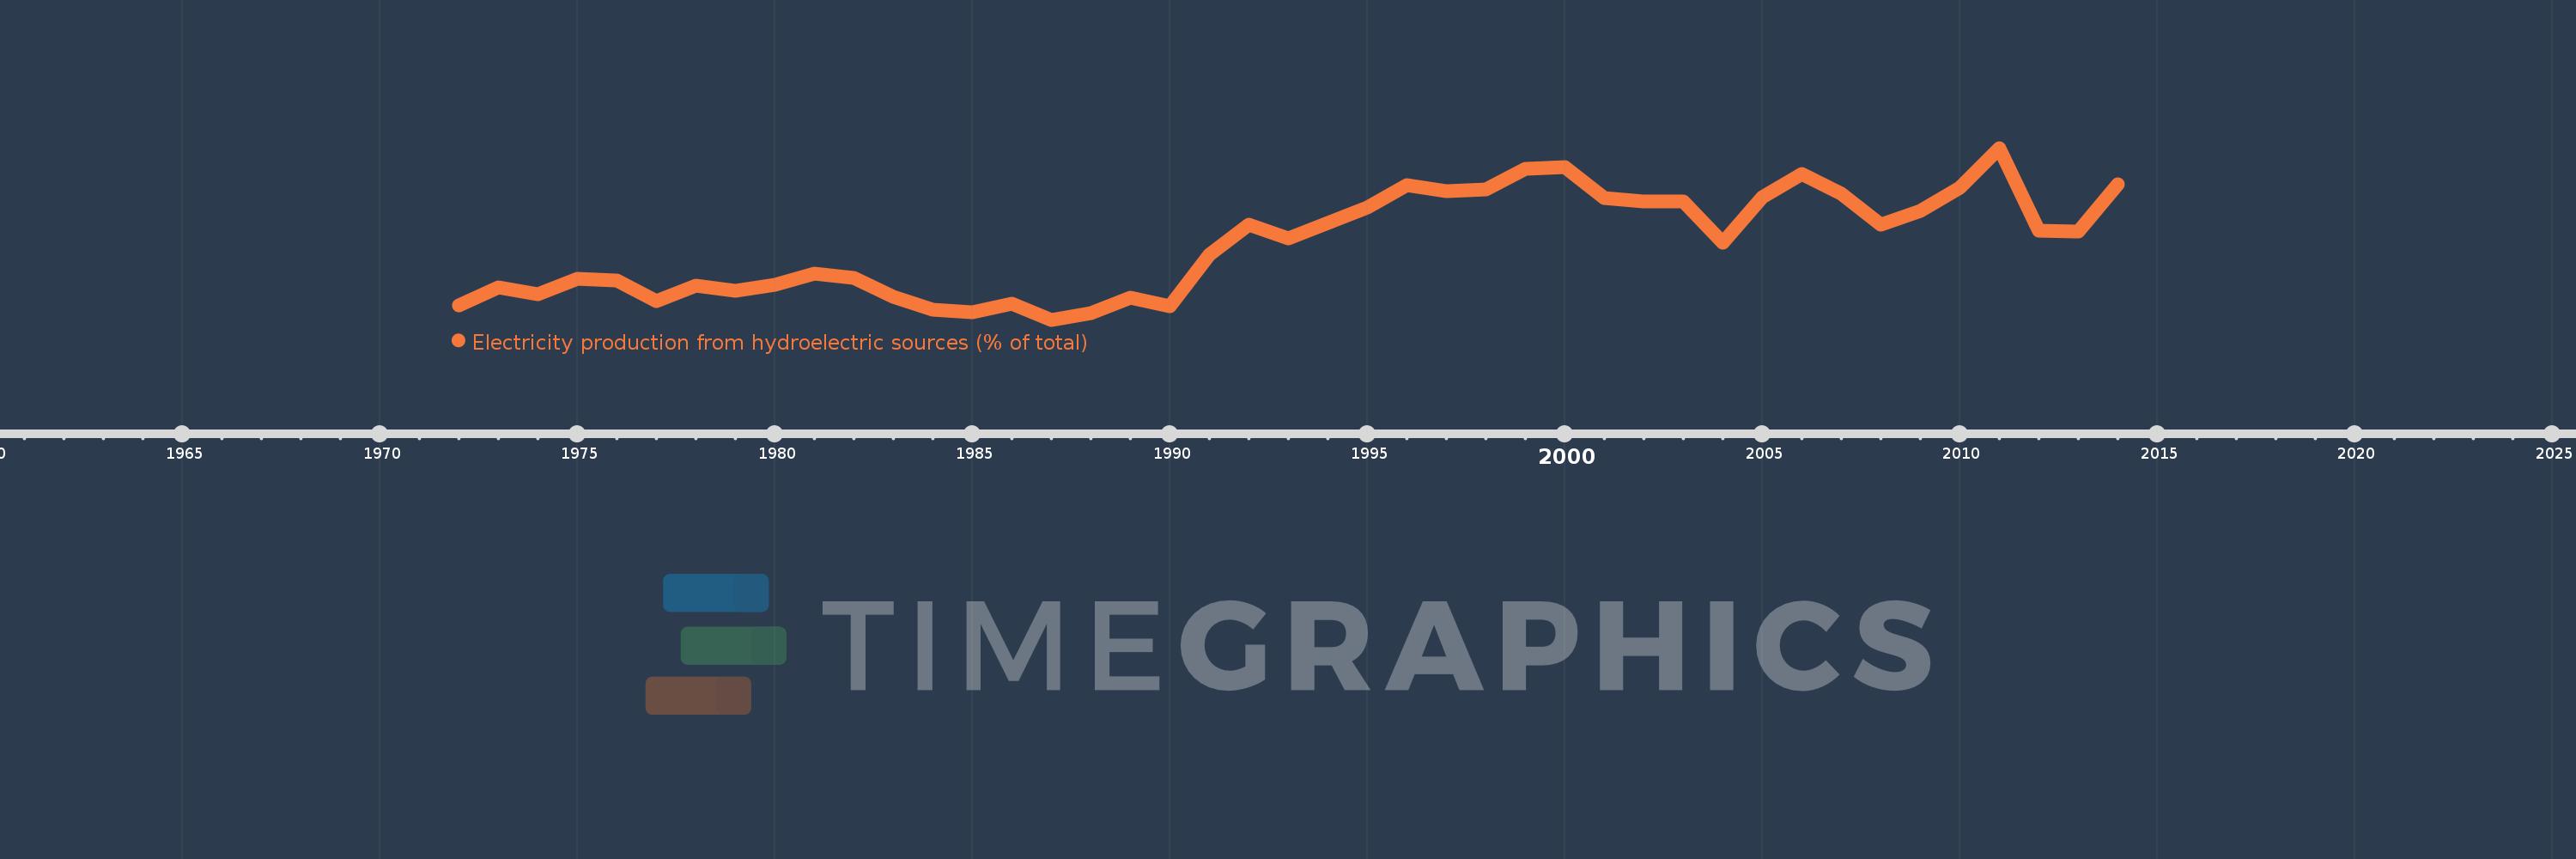
Electricity production from hydroelectric sources (% of total)
2014,2013,2012,2011,2010,2009,2008,2007,2006,2005,2004,2003,2002,2001,2000,1999,1998,1997,1996,1995,1994,1993,1992,1991,1990,1989,1988,1987,1986,1985,1984,1983,1982,1981,1980,1979,1978,1977,1976,1975,1974,1973,1972
This statistics in other country:
AlbaniaAlgeriaAngolaArab WorldArgentinaArmeniaAustraliaAustriaAzerbaijanBahrainBangladeshBelarusBelgiumBeninBoliviaBosnia and HerzegovinaBotswanaBrazilBrunei DarussalamBulgariaCambodiaCameroonCanadaCentral Europe and the BalticsChileChinaColombiaCongo, Dem. Rep.Congo, Rep.Costa RicaCote d'IvoireCroatiaCubaCuracaoCyprusCzech RepublicDenmarkDominican RepublicEarly-demographic dividendEast Asia & PacificEast Asia & Pacific (excluding high income)East Asia & Pacific (IDA & IBRD countries)EcuadorEgypt, Arab Rep.El SalvadorEritreaEstoniaEthiopiaEuro areaEurope & Central AsiaEurope & Central Asia (excluding high income)Europe & Central Asia (IDA & IBRD countries)European UnionFinlandFragile and conflict affected situationsFranceGabonGeorgiaGermanyGhanaGibraltarGreeceGuatemalaHaitiHeavily indebted poor countries (HIPC)High incomeHondurasHong Kong SAR, ChinaHungaryIBRD onlyIcelandIDA & IBRD totalIDA blendIDA onlyIDA totalIndiaIndonesiaIran, Islamic Rep.IraqIrelandIsraelItalyJamaicaJapanJordanKazakhstanKenyaKorea, Dem. People’s Rep.Korea, Rep.KosovoKuwaitKyrgyz RepublicLate-demographic dividendLatin America & Caribbean Latin America & Caribbean (excluding high income)Latin America & the Caribbean (IDA & IBRD countries)LatviaLeast developed countries: UN classificationLebanonLibyaLithuaniaLow & middle incomeLower middle incomeLuxembourgMacedonia, FYRMalaysiaMaltaMauritiusMexicoMiddle East & North AfricaMiddle East & North Africa (excluding high income)Middle East & North Africa (IDA & IBRD countries)Middle incomeMoldovaMongoliaMontenegroMoroccoMozambiqueMyanmarNamibiaNepalNetherlandsNew ZealandNicaraguaNigerNigeriaNorth AmericaNorwayOECD membersOmanOther small statesPakistanPanamaParaguayPeruPhilippinesPolandPortugalPost-demographic dividendPre-demographic dividendQatarRomaniaRussian FederationSaudi ArabiaSenegalSerbiaSingaporeSlovak RepublicSloveniaSmall statesSouth AfricaSouth AsiaSouth Asia (IDA & IBRD)South SudanSpainSri LankaSub-Saharan Africa Sub-Saharan Africa (excluding high income)Sub-Saharan Africa (IDA & IBRD countries)SudanSwedenSwitzerlandSyrian Arab RepublicTajikistanTanzaniaThailandTogoTrinidad and TobagoTunisiaTurkeyTurkmenistanUkraineUnited Arab EmiratesUnited KingdomUnited StatesUpper middle incomeUruguayUzbekistanVenezuela, RBVietnamWorldYemen, Rep.ZambiaZimbabwe Timeline:
This timeline shows a graph from 1972 to 2014 of Central Europe and the Baltics. No data until 1971. Number of actual observations by date: 43.
Source name:
World Development Indicators
Source organization:
IEA Statistics © OECD/IEA 2014 (http://www.iea.org/stats/index.asp), subject to https://www.iea.org/t&c/termsandconditions/
Categories, topics:
Energy & Mining, Climate Change, Infrastructure
Last updated:
apr 23, 2017
Indicators value changes by year
Maximum:
11.312
jan 1, 2011
At the date of observation
Value
Absolute change
Change from previous value
jan 1, 1972
4.753
+4.753
0.0%
jan 1, 1973
5.489
+0.736
15.49%
jan 1, 1974
5.219
-0.27
-4.92%
jan 1, 1975
5.852
+0.633
12.14%
jan 1, 1976
5.774
-0.078
-1.34%
jan 1, 1977
4.938
-0.836
-14.49%
jan 1, 1978
5.567
+0.63
12.75%
jan 1, 1979
5.349
-0.218
-3.91%
jan 1, 1980
5.62
+0.271
5.06%
jan 1, 1981
6.088
+0.468
8.33%
jan 1, 1982
5.903
-0.185
-3.04%
jan 1, 1983
5.104
-0.799
-13.54%
jan 1, 1984
4.58
-0.524
-10.26%
jan 1, 1985
4.466
-0.115
-2.5%
jan 1, 1986
4.834
+0.368
8.25%
jan 1, 1987
4.148
-0.686
-14.19%
jan 1, 1988
4.406
+0.258
6.22%
jan 1, 1989
5.084
+0.678
15.38%
jan 1, 1990
4.726
-0.358
-7.04%
jan 1, 1991
6.861
+2.135
45.18%
jan 1, 1992
8.111
+1.25
18.22%
jan 1, 1993
7.531
-0.581
-7.16%
jan 1, 1994
8.185
+0.654
8.68%
jan 1, 1995
8.833
+0.649
7.93%
jan 1, 1996
9.769
+0.936
10.59%
jan 1, 1997
9.509
-0.26
-2.67%
jan 1, 1998
9.568
+0.059
0.62%
jan 1, 1999
10.431
+0.863
9.02%
jan 1, 2000
10.503
+0.072
0.69%
jan 1, 2001
9.221
-1.282
-12.21%
jan 1, 2002
9.068
-0.153
-1.65%
jan 1, 2003
9.077
+0.009
0.1%
jan 1, 2004
7.35
-1.727
-19.03%
jan 1, 2005
9.267
+1.917
26.08%
jan 1, 2006
10.232
+0.965
10.42%
jan 1, 2007
9.385
-0.847
-8.28%
jan 1, 2008
8.104
-1.281
-13.65%
jan 1, 2009
8.696
+0.592
7.31%
jan 1, 2010
9.663
+0.967
11.12%
jan 1, 2011
11.312
+1.649
17.06%
jan 1, 2012
7.852
-3.46
-30.59%
jan 1, 2013
7.837
-0.015
-0.19%
jan 1, 2014
9.786
+1.949
24.87%
Ranking of countries by current statistics by years


Comments: