29
/
en
AIzaSyAYiBZKx7MnpbEhh9jyipgxe19OcubqV5w
April 1, 2024
285773
Zambia
ZMB
true
2
1
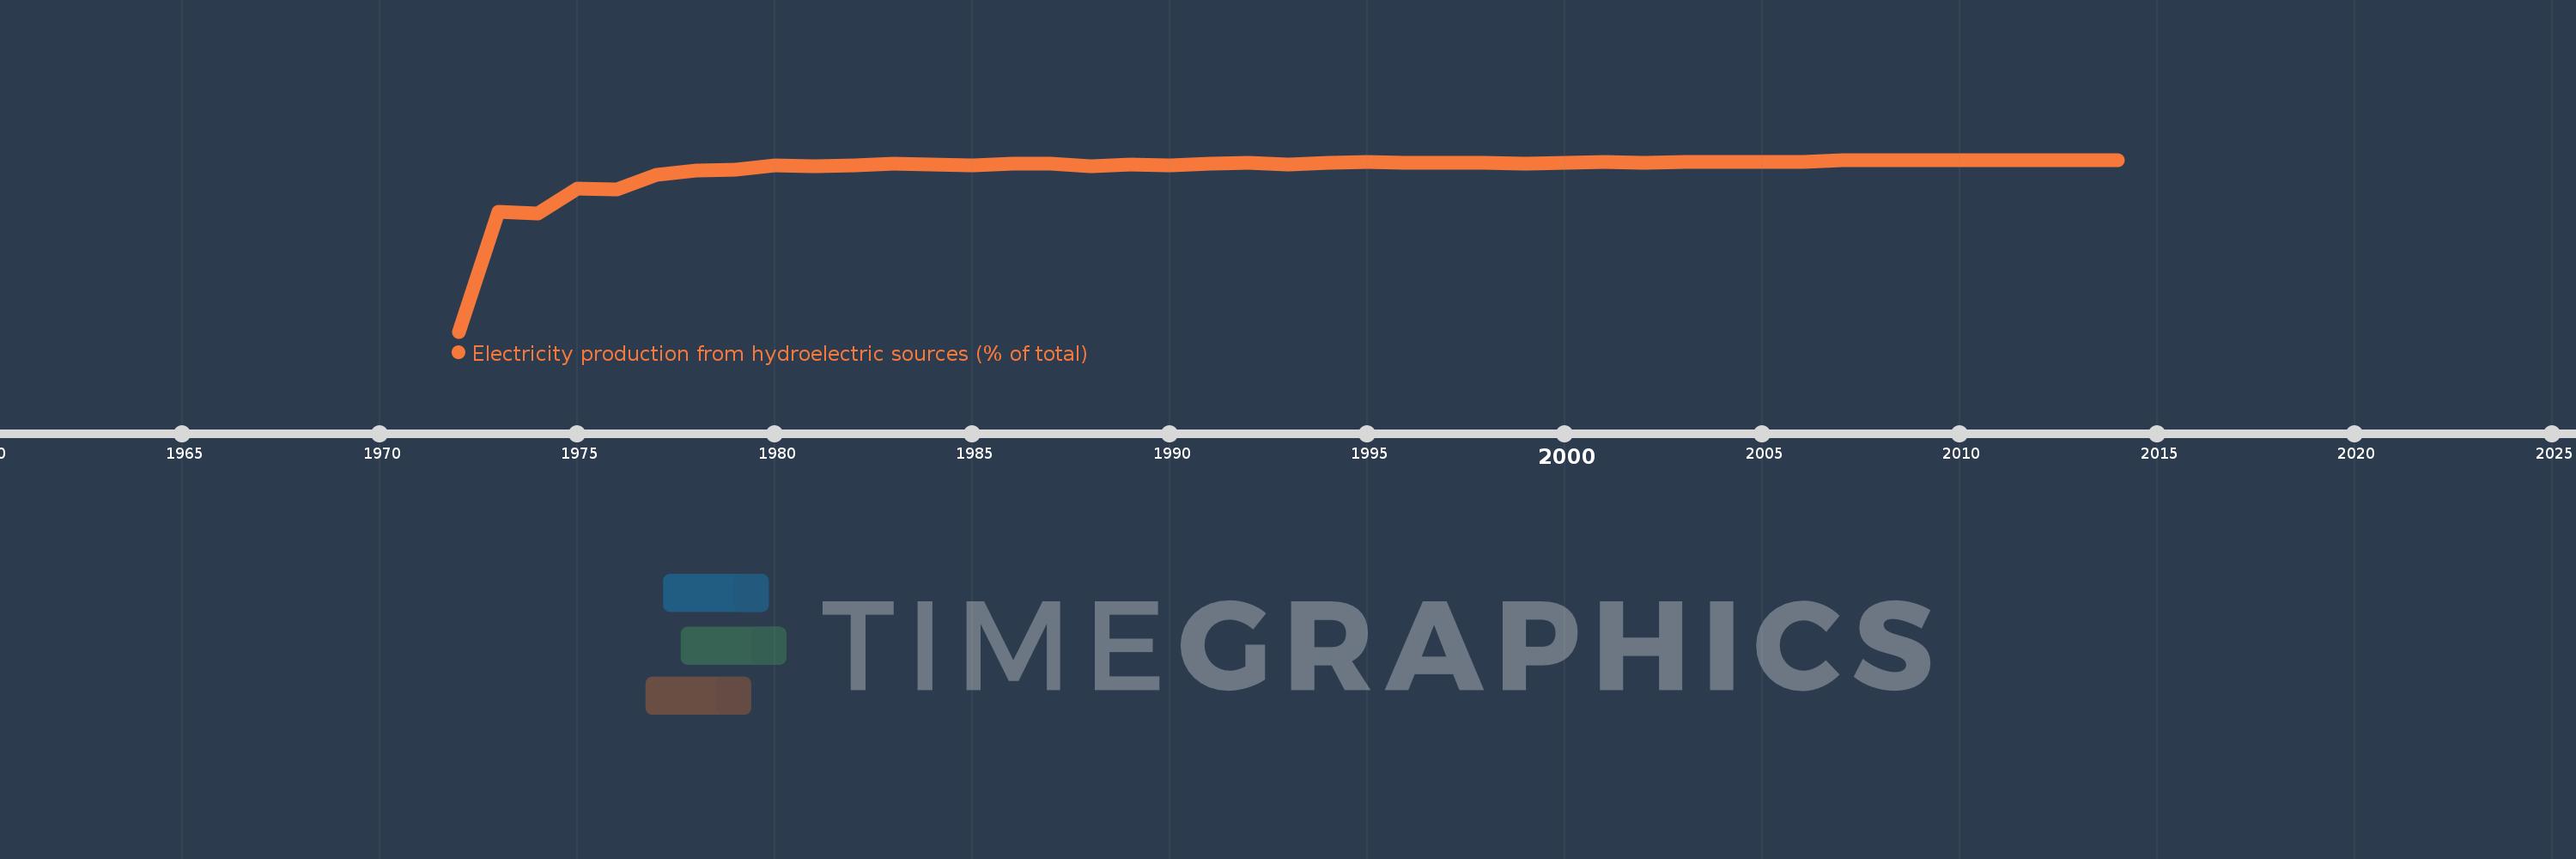
Electricity production from hydroelectric sources (% of total)
2014,2013,2012,2011,2010,2009,2008,2007,2006,2005,2004,2003,2002,2001,2000,1999,1998,1997,1996,1995,1994,1993,1992,1991,1990,1989,1988,1987,1986,1985,1984,1983,1982,1981,1980,1979,1978,1977,1976,1975,1974,1973,1972
This statistics in other country:
AlbaniaAlgeriaAngolaArab WorldArgentinaArmeniaAustraliaAustriaAzerbaijanBahrainBangladeshBelarusBelgiumBeninBoliviaBosnia and HerzegovinaBotswanaBrazilBrunei DarussalamBulgariaCambodiaCameroonCanadaCentral Europe and the BalticsChileChinaColombiaCongo, Dem. Rep.Congo, Rep.Costa RicaCote d'IvoireCroatiaCubaCuracaoCyprusCzech RepublicDenmarkDominican RepublicEarly-demographic dividendEast Asia & PacificEast Asia & Pacific (excluding high income)East Asia & Pacific (IDA & IBRD countries)EcuadorEgypt, Arab Rep.El SalvadorEritreaEstoniaEthiopiaEuro areaEurope & Central AsiaEurope & Central Asia (excluding high income)Europe & Central Asia (IDA & IBRD countries)European UnionFinlandFragile and conflict affected situationsFranceGabonGeorgiaGermanyGhanaGibraltarGreeceGuatemalaHaitiHeavily indebted poor countries (HIPC)High incomeHondurasHong Kong SAR, ChinaHungaryIBRD onlyIcelandIDA & IBRD totalIDA blendIDA onlyIDA totalIndiaIndonesiaIran, Islamic Rep.IraqIrelandIsraelItalyJamaicaJapanJordanKazakhstanKenyaKorea, Dem. People’s Rep.Korea, Rep.KosovoKuwaitKyrgyz RepublicLate-demographic dividendLatin America & Caribbean Latin America & Caribbean (excluding high income)Latin America & the Caribbean (IDA & IBRD countries)LatviaLeast developed countries: UN classificationLebanonLibyaLithuaniaLow & middle incomeLower middle incomeLuxembourgMacedonia, FYRMalaysiaMaltaMauritiusMexicoMiddle East & North AfricaMiddle East & North Africa (excluding high income)Middle East & North Africa (IDA & IBRD countries)Middle incomeMoldovaMongoliaMontenegroMoroccoMozambiqueMyanmarNamibiaNepalNetherlandsNew ZealandNicaraguaNigerNigeriaNorth AmericaNorwayOECD membersOmanOther small statesPakistanPanamaParaguayPeruPhilippinesPolandPortugalPost-demographic dividendPre-demographic dividendQatarRomaniaRussian FederationSaudi ArabiaSenegalSerbiaSingaporeSlovak RepublicSloveniaSmall statesSouth AfricaSouth AsiaSouth Asia (IDA & IBRD)South SudanSpainSri LankaSub-Saharan Africa Sub-Saharan Africa (excluding high income)Sub-Saharan Africa (IDA & IBRD countries)SudanSwedenSwitzerlandSyrian Arab RepublicTajikistanTanzaniaThailandTogoTrinidad and TobagoTunisiaTurkeyTurkmenistanUkraineUnited Arab EmiratesUnited KingdomUnited StatesUpper middle incomeUruguayUzbekistanVenezuela, RBVietnamWorldYemen, Rep.ZambiaZimbabwe Timeline:
This timeline shows a graph from 1972 to 2014 of Zambia. No data until 1971. Number of actual observations by date: 43.
Source name:
World Development Indicators
Source organization:
IEA Statistics © OECD/IEA 2014 (http://www.iea.org/stats/index.asp), subject to https://www.iea.org/t&c/termsandconditions/
Categories, topics:
Energy & Mining, Climate Change, Infrastructure
Last updated:
apr 23, 2017
Indicators value changes by year
Minimum:
74.671
jan 1, 1972
Maximum:
99.748
jan 1, 2010
At the date of observation
Value
Absolute change
Change from previous value
jan 1, 1972
74.671
+74.671
0.0%
jan 1, 1973
92.162
+17.49
23.42%
jan 1, 1974
91.954
-0.208
-0.23%
jan 1, 1975
95.518
+3.565
3.88%
jan 1, 1976
95.442
-0.077
-0.08%
jan 1, 1977
97.581
+2.139
2.24%
jan 1, 1978
98.126
+0.546
0.56%
jan 1, 1979
98.282
+0.156
0.16%
jan 1, 1980
98.989
+0.707
0.72%
jan 1, 1981
98.86
-0.129
-0.13%
jan 1, 1982
98.967
+0.107
0.11%
jan 1, 1983
99.178
+0.211
0.21%
jan 1, 1984
99.035
-0.144
-0.14%
jan 1, 1985
98.964
-0.071
-0.07%
jan 1, 1986
99.146
+0.182
0.18%
jan 1, 1987
99.122
-0.024
-0.02%
jan 1, 1988
98.816
-0.305
-0.31%
jan 1, 1989
99.041
+0.224
0.23%
jan 1, 1990
98.974
-0.066
-0.07%
jan 1, 1991
99.226
+0.252
0.25%
jan 1, 1992
99.282
+0.055
0.06%
jan 1, 1993
99.073
-0.209
-0.21%
jan 1, 1994
99.293
+0.22
0.22%
jan 1, 1995
99.398
+0.106
0.11%
jan 1, 1996
99.331
-0.067
-0.07%
jan 1, 1997
99.288
-0.043
-0.04%
jan 1, 1998
99.307
+0.019
0.02%
jan 1, 1999
99.158
-0.149
-0.15%
jan 1, 2000
99.33
+0.172
0.17%
jan 1, 2001
99.384
+0.054
0.05%
jan 1, 2002
99.371
-0.014
-0.01%
jan 1, 2003
99.374
+0.004
0.0%
jan 1, 2004
99.374
0.0
0.0%
jan 1, 2005
99.436
+0.062
0.06%
jan 1, 2006
99.407
-0.029
-0.03%
jan 1, 2007
99.66
+0.253
0.25%
jan 1, 2008
99.741
+0.081
0.08%
jan 1, 2009
99.717
-0.024
-0.02%
jan 1, 2010
99.748
+0.03
0.03%
jan 1, 2011
99.732
-0.015
-0.02%
jan 1, 2012
99.687
-0.045
-0.05%
jan 1, 2013
99.701
+0.014
0.01%
jan 1, 2014
99.715
+0.013
0.01%
Ranking of countries by current statistics by years


Comments: