29
/
en
AIzaSyAYiBZKx7MnpbEhh9jyipgxe19OcubqV5w
April 1, 2024
135402
Gabon
GAB
true
2
1
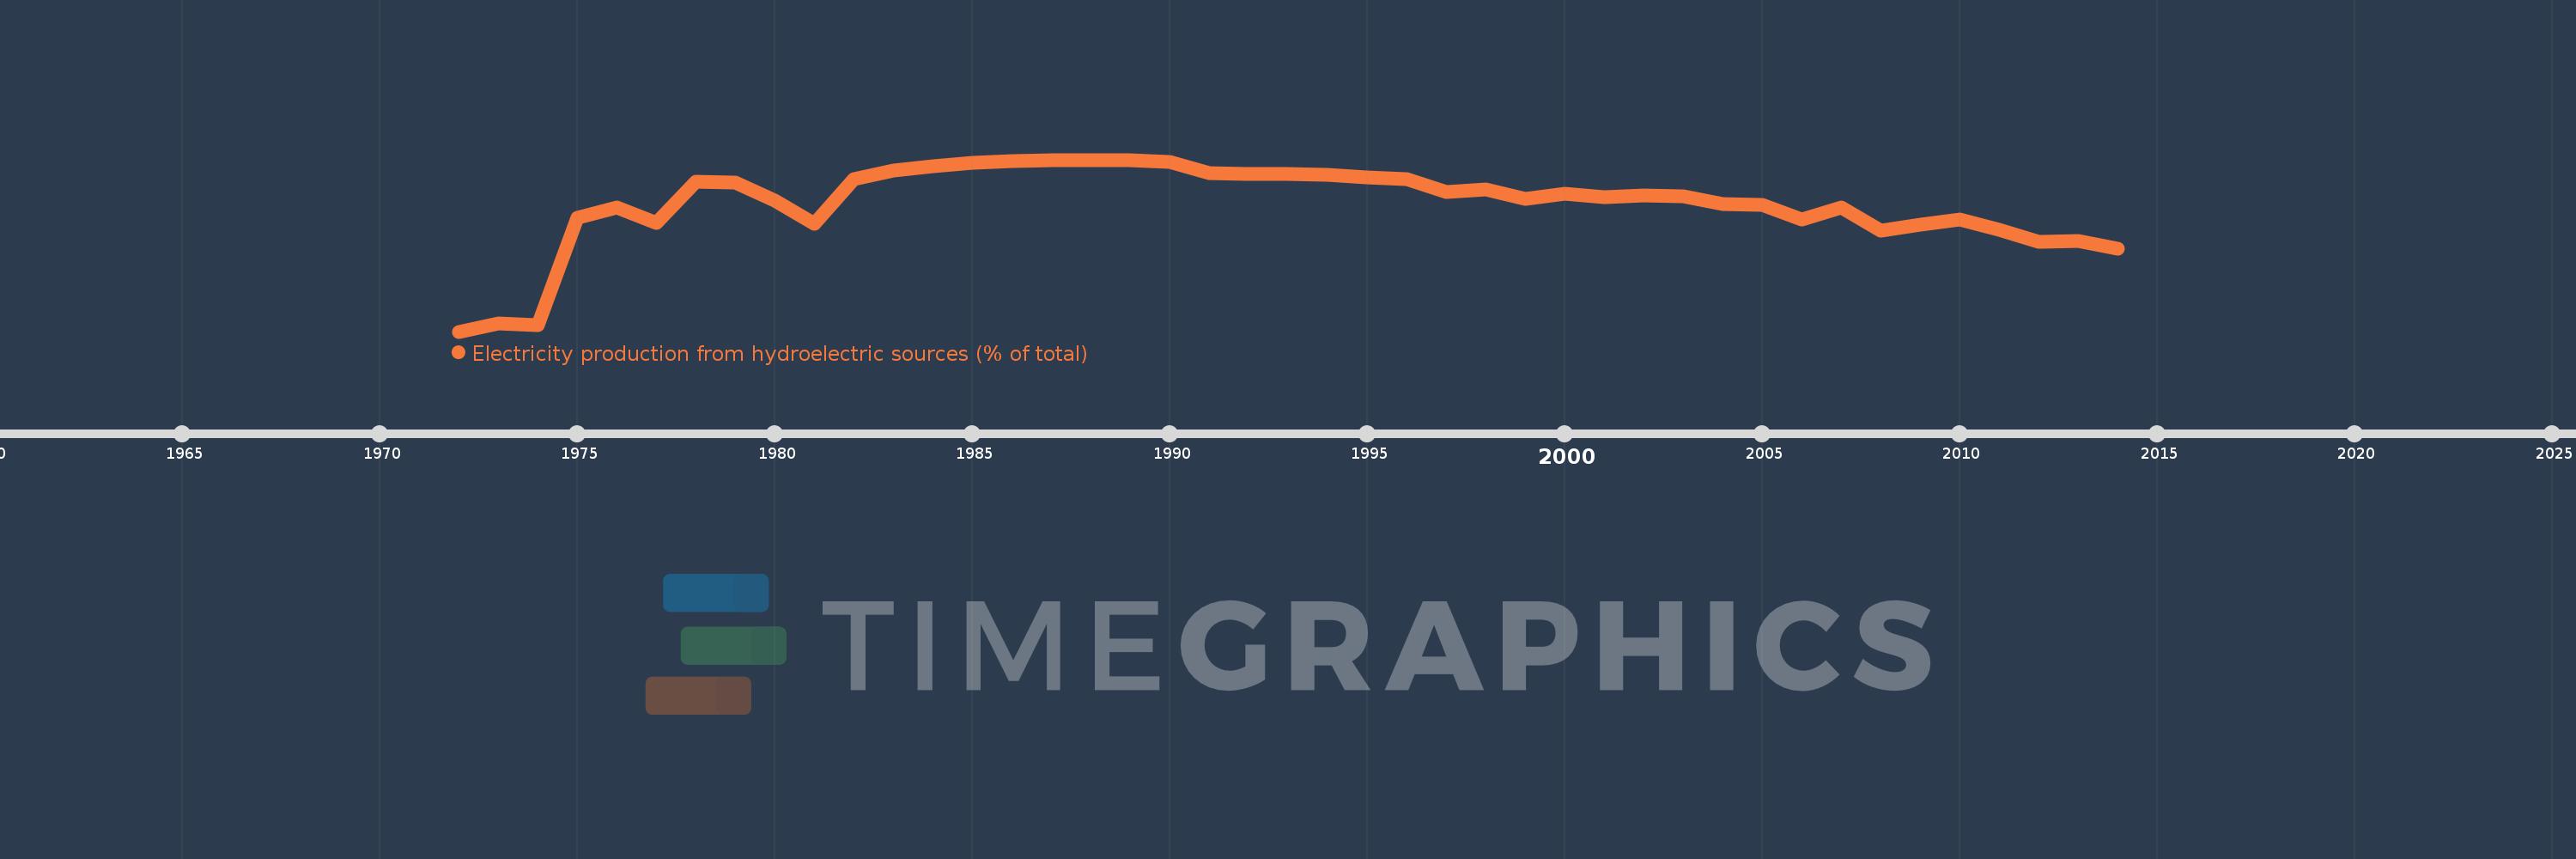
Electricity production from hydroelectric sources (% of total)
2014,2013,2012,2011,2010,2009,2008,2007,2006,2005,2004,2003,2002,2001,2000,1999,1998,1997,1996,1995,1994,1993,1992,1991,1990,1989,1988,1987,1986,1985,1984,1983,1982,1981,1980,1979,1978,1977,1976,1975,1974,1973,1972
This statistics in other country:
AlbaniaAlgeriaAngolaArab WorldArgentinaArmeniaAustraliaAustriaAzerbaijanBahrainBangladeshBelarusBelgiumBeninBoliviaBosnia and HerzegovinaBotswanaBrazilBrunei DarussalamBulgariaCambodiaCameroonCanadaCentral Europe and the BalticsChileChinaColombiaCongo, Dem. Rep.Congo, Rep.Costa RicaCote d'IvoireCroatiaCubaCuracaoCyprusCzech RepublicDenmarkDominican RepublicEarly-demographic dividendEast Asia & PacificEast Asia & Pacific (excluding high income)East Asia & Pacific (IDA & IBRD countries)EcuadorEgypt, Arab Rep.El SalvadorEritreaEstoniaEthiopiaEuro areaEurope & Central AsiaEurope & Central Asia (excluding high income)Europe & Central Asia (IDA & IBRD countries)European UnionFinlandFragile and conflict affected situationsFranceGabonGeorgiaGermanyGhanaGibraltarGreeceGuatemalaHaitiHeavily indebted poor countries (HIPC)High incomeHondurasHong Kong SAR, ChinaHungaryIBRD onlyIcelandIDA & IBRD totalIDA blendIDA onlyIDA totalIndiaIndonesiaIran, Islamic Rep.IraqIrelandIsraelItalyJamaicaJapanJordanKazakhstanKenyaKorea, Dem. People’s Rep.Korea, Rep.KosovoKuwaitKyrgyz RepublicLate-demographic dividendLatin America & Caribbean Latin America & Caribbean (excluding high income)Latin America & the Caribbean (IDA & IBRD countries)LatviaLeast developed countries: UN classificationLebanonLibyaLithuaniaLow & middle incomeLower middle incomeLuxembourgMacedonia, FYRMalaysiaMaltaMauritiusMexicoMiddle East & North AfricaMiddle East & North Africa (excluding high income)Middle East & North Africa (IDA & IBRD countries)Middle incomeMoldovaMongoliaMontenegroMoroccoMozambiqueMyanmarNamibiaNepalNetherlandsNew ZealandNicaraguaNigerNigeriaNorth AmericaNorwayOECD membersOmanOther small statesPakistanPanamaParaguayPeruPhilippinesPolandPortugalPost-demographic dividendPre-demographic dividendQatarRomaniaRussian FederationSaudi ArabiaSenegalSerbiaSingaporeSlovak RepublicSloveniaSmall statesSouth AfricaSouth AsiaSouth Asia (IDA & IBRD)South SudanSpainSri LankaSub-Saharan Africa Sub-Saharan Africa (excluding high income)Sub-Saharan Africa (IDA & IBRD countries)SudanSwedenSwitzerlandSyrian Arab RepublicTajikistanTanzaniaThailandTogoTrinidad and TobagoTunisiaTurkeyTurkmenistanUkraineUnited Arab EmiratesUnited KingdomUnited StatesUpper middle incomeUruguayUzbekistanVenezuela, RBVietnamWorldYemen, Rep.ZambiaZimbabwe Timeline:
This timeline shows a graph from 1972 to 2014 of Gabon. No data until 1971. Number of actual observations by date: 43.
Source name:
World Development Indicators
Source organization:
IEA Statistics © OECD/IEA 2014 (http://www.iea.org/stats/index.asp), subject to https://www.iea.org/t&c/termsandconditions/
Categories, topics:
Energy & Mining, Climate Change, Infrastructure
Last updated:
apr 23, 2017
Indicators value changes by year
Maximum:
78.041
jan 1, 1987
At the date of observation
Value
Absolute change
Change from previous value
jan 1, 1973
3.731
+3.731
%
jan 1, 1974
3.03
-0.701
-18.79%
jan 1, 1975
51.813
+48.783
1.61K%
jan 1, 1976
56.522
+4.708
9.09%
jan 1, 1977
49.39
-7.131
-12.62%
jan 1, 1978
67.946
+18.556
37.57%
jan 1, 1979
67.89
-0.056
-0.08%
jan 1, 1980
59.615
-8.275
-12.19%
jan 1, 1981
49.057
-10.559
-17.71%
jan 1, 1982
69.244
+20.187
41.15%
jan 1, 1983
73.013
+3.77
5.44%
jan 1, 1984
75.034
+2.021
2.77%
jan 1, 1985
76.73
+1.695
2.26%
jan 1, 1986
77.468
+0.739
0.96%
jan 1, 1987
78.041
+0.572
0.74%
jan 1, 1988
77.989
-0.052
-0.07%
jan 1, 1989
77.912
-0.077
-0.1%
jan 1, 1990
77.055
-0.857
-1.1%
jan 1, 1991
72.086
-4.969
-6.45%
jan 1, 1992
71.777
-0.309
-0.43%
jan 1, 1993
71.702
-0.075
-0.1%
jan 1, 1994
71.071
-0.631
-0.88%
jan 1, 1995
69.981
-1.09
-1.53%
jan 1, 1996
69.447
-0.534
-0.76%
jan 1, 1997
63.427
-6.02
-8.67%
jan 1, 1998
64.411
+0.984
1.55%
jan 1, 1999
60.462
-3.949
-6.13%
jan 1, 2000
62.575
+2.114
3.5%
jan 1, 2001
61.065
-1.511
-2.41%
jan 1, 2002
61.657
+0.593
0.97%
jan 1, 2003
61.615
-0.042
-0.07%
jan 1, 2004
57.99
-3.626
-5.88%
jan 1, 2005
57.428
-0.562
-0.97%
jan 1, 2006
51.037
-6.391
-11.13%
jan 1, 2007
56.217
+5.179
10.15%
jan 1, 2008
45.798
-10.419
-18.53%
jan 1, 2009
48.746
+2.948
6.44%
jan 1, 2010
51.027
+2.281
4.68%
jan 1, 2011
46.205
-4.822
-9.45%
jan 1, 2012
40.836
-5.369
-11.62%
jan 1, 2013
41.31
+0.474
1.16%
jan 1, 2014
37.5
-3.81
-9.22%
Ranking of countries by current statistics by years


Comments: