29
/
en
AIzaSyAYiBZKx7MnpbEhh9jyipgxe19OcubqV5w
April 1, 2024
287083
Zimbabwe
ZWE
true
2
1
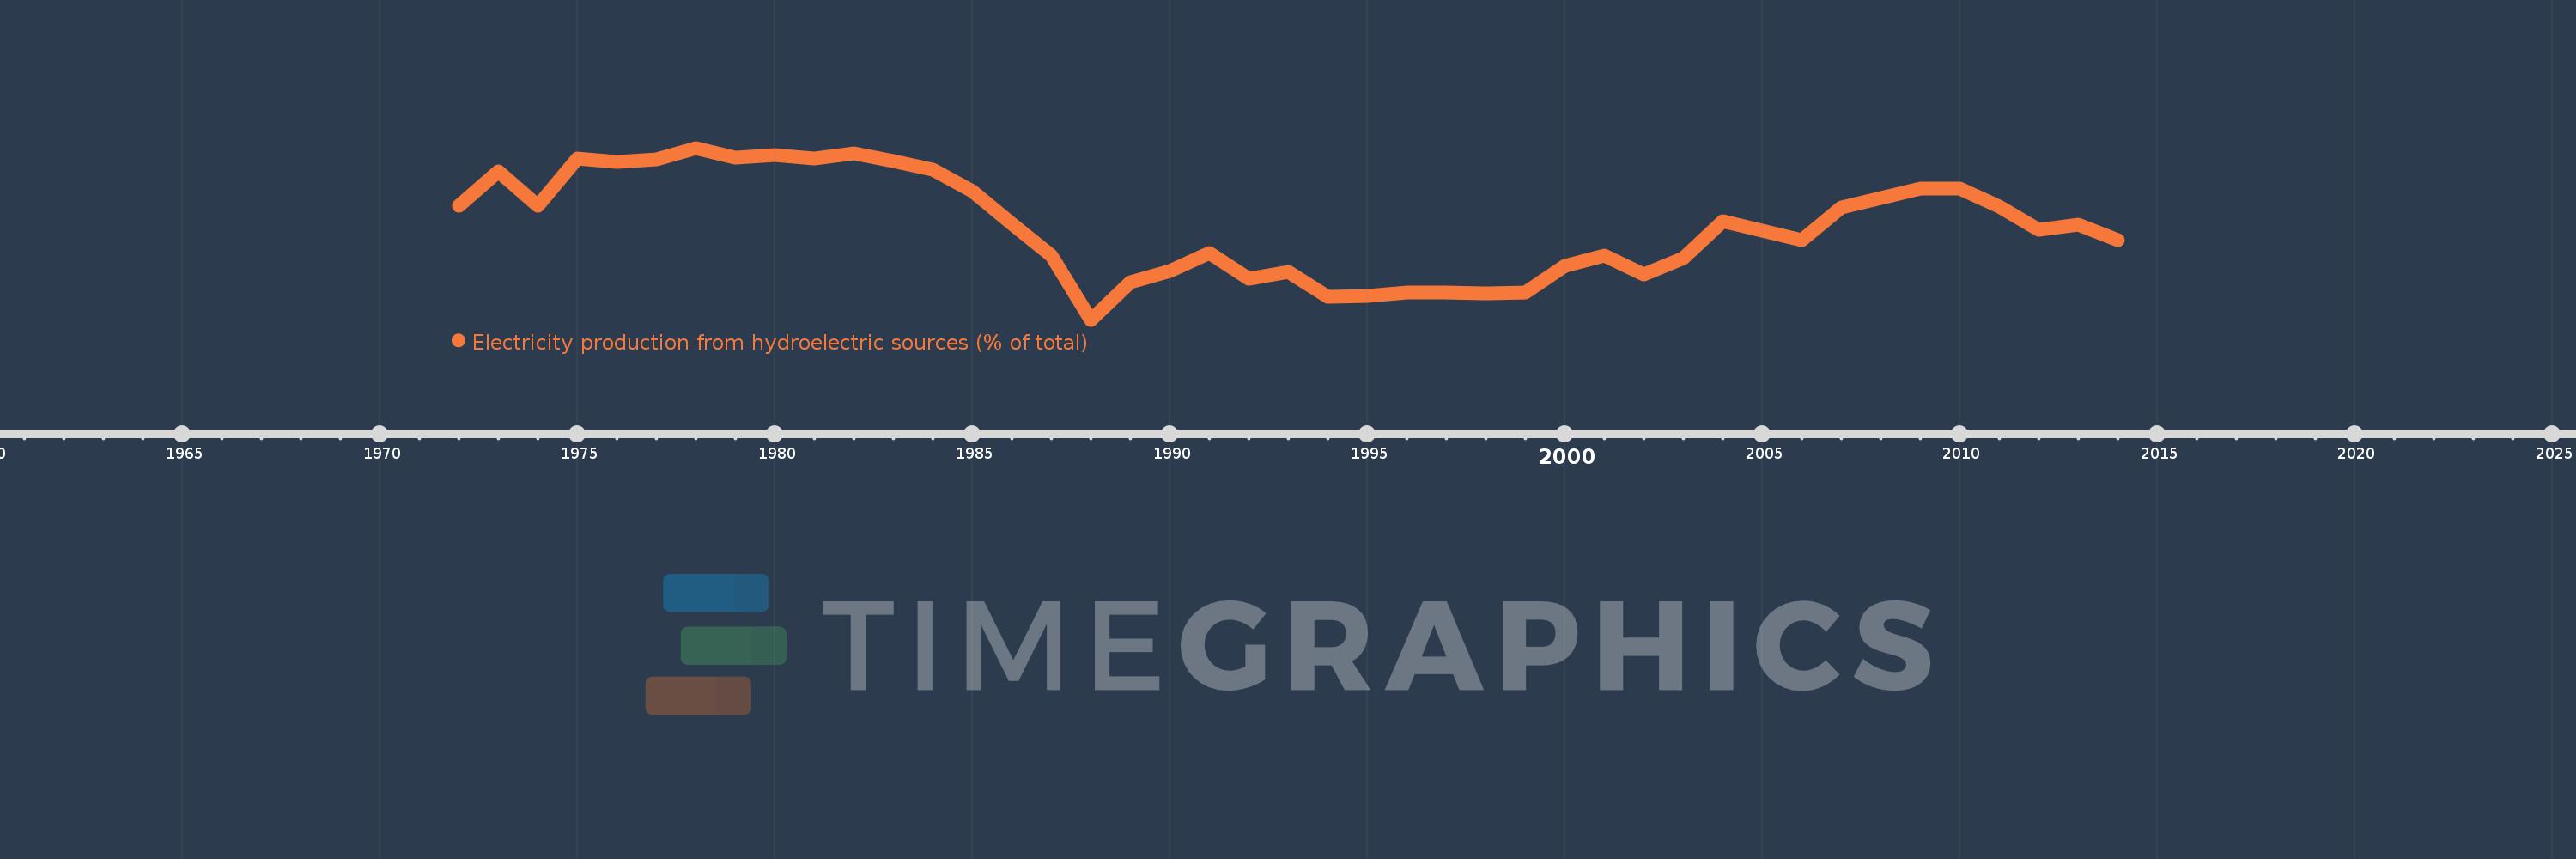
Electricity production from hydroelectric sources (% of total)
2014,2013,2012,2011,2010,2009,2008,2007,2006,2005,2004,2003,2002,2001,2000,1999,1998,1997,1996,1995,1994,1993,1992,1991,1990,1989,1988,1987,1986,1985,1984,1983,1982,1981,1980,1979,1978,1977,1976,1975,1974,1973,1972
This statistics in other country:
AlbaniaAlgeriaAngolaArab WorldArgentinaArmeniaAustraliaAustriaAzerbaijanBahrainBangladeshBelarusBelgiumBeninBoliviaBosnia and HerzegovinaBotswanaBrazilBrunei DarussalamBulgariaCambodiaCameroonCanadaCentral Europe and the BalticsChileChinaColombiaCongo, Dem. Rep.Congo, Rep.Costa RicaCote d'IvoireCroatiaCubaCuracaoCyprusCzech RepublicDenmarkDominican RepublicEarly-demographic dividendEast Asia & PacificEast Asia & Pacific (excluding high income)East Asia & Pacific (IDA & IBRD countries)EcuadorEgypt, Arab Rep.El SalvadorEritreaEstoniaEthiopiaEuro areaEurope & Central AsiaEurope & Central Asia (excluding high income)Europe & Central Asia (IDA & IBRD countries)European UnionFinlandFragile and conflict affected situationsFranceGabonGeorgiaGermanyGhanaGibraltarGreeceGuatemalaHaitiHeavily indebted poor countries (HIPC)High incomeHondurasHong Kong SAR, ChinaHungaryIBRD onlyIcelandIDA & IBRD totalIDA blendIDA onlyIDA totalIndiaIndonesiaIran, Islamic Rep.IraqIrelandIsraelItalyJamaicaJapanJordanKazakhstanKenyaKorea, Dem. People’s Rep.Korea, Rep.KosovoKuwaitKyrgyz RepublicLate-demographic dividendLatin America & Caribbean Latin America & Caribbean (excluding high income)Latin America & the Caribbean (IDA & IBRD countries)LatviaLeast developed countries: UN classificationLebanonLibyaLithuaniaLow & middle incomeLower middle incomeLuxembourgMacedonia, FYRMalaysiaMaltaMauritiusMexicoMiddle East & North AfricaMiddle East & North Africa (excluding high income)Middle East & North Africa (IDA & IBRD countries)Middle incomeMoldovaMongoliaMontenegroMoroccoMozambiqueMyanmarNamibiaNepalNetherlandsNew ZealandNicaraguaNigerNigeriaNorth AmericaNorwayOECD membersOmanOther small statesPakistanPanamaParaguayPeruPhilippinesPolandPortugalPost-demographic dividendPre-demographic dividendQatarRomaniaRussian FederationSaudi ArabiaSenegalSerbiaSingaporeSlovak RepublicSloveniaSmall statesSouth AfricaSouth AsiaSouth Asia (IDA & IBRD)South SudanSpainSri LankaSub-Saharan Africa Sub-Saharan Africa (excluding high income)Sub-Saharan Africa (IDA & IBRD countries)SudanSwedenSwitzerlandSyrian Arab RepublicTajikistanTanzaniaThailandTogoTrinidad and TobagoTunisiaTurkeyTurkmenistanUkraineUnited Arab EmiratesUnited KingdomUnited StatesUpper middle incomeUruguayUzbekistanVenezuela, RBVietnamWorldYemen, Rep.ZambiaZimbabwe Timeline:
This timeline shows a graph from 1972 to 2014 of Zimbabwe. No data until 1971. Number of actual observations by date: 43.
Source name:
World Development Indicators
Source organization:
IEA Statistics © OECD/IEA 2014 (http://www.iea.org/stats/index.asp), subject to https://www.iea.org/t&c/termsandconditions/
Categories, topics:
Energy & Mining, Climate Change, Infrastructure
Last updated:
apr 23, 2017
Indicators value changes by year
Minimum:
17.463
jan 1, 1988
Maximum:
92.852
jan 1, 1978
At the date of observation
Value
Absolute change
Change from previous value
jan 1, 1972
67.324
+67.324
0.0%
jan 1, 1973
82.729
+15.405
22.88%
jan 1, 1974
67.421
-15.308
-18.5%
jan 1, 1975
88.079
+20.658
30.64%
jan 1, 1976
86.666
-1.413
-1.6%
jan 1, 1977
87.985
+1.32
1.52%
jan 1, 1978
92.852
+4.866
5.53%
jan 1, 1979
88.693
-4.158
-4.48%
jan 1, 1980
89.603
+0.909
1.03%
jan 1, 1981
88.262
-1.34
-1.5%
jan 1, 1982
90.561
+2.298
2.6%
jan 1, 1983
86.977
-3.584
-3.96%
jan 1, 1984
83.381
-3.595
-4.13%
jan 1, 1985
73.786
-9.595
-11.51%
jan 1, 1986
59.699
-14.087
-19.09%
jan 1, 1987
45.561
-14.138
-23.68%
jan 1, 1988
17.463
-28.099
-61.67%
jan 1, 1989
33.924
+16.462
94.27%
jan 1, 1990
38.849
+4.925
14.52%
jan 1, 1991
46.667
+7.818
20.12%
jan 1, 1992
35.32
-11.347
-24.31%
jan 1, 1993
38.376
+3.055
8.65%
jan 1, 1994
27.611
-10.764
-28.05%
jan 1, 1995
27.804
+0.192
0.7%
jan 1, 1996
29.254
+1.45
5.22%
jan 1, 1997
29.537
+0.283
0.97%
jan 1, 1998
29.09
-0.447
-1.51%
jan 1, 1999
29.257
+0.167
0.57%
jan 1, 2000
41.01
+11.753
40.17%
jan 1, 2001
45.661
+4.651
11.34%
jan 1, 2002
37.503
-8.158
-17.87%
jan 1, 2003
44.358
+6.855
18.28%
jan 1, 2004
60.734
+16.376
36.92%
jan 1, 2005
56.6
-4.134
-6.81%
jan 1, 2006
52.432
-4.168
-7.36%
jan 1, 2007
66.591
+14.159
27.0%
jan 1, 2008
70.745
+4.154
6.24%
jan 1, 2009
74.859
+4.114
5.82%
jan 1, 2010
74.859
+0.0
0.0%
jan 1, 2011
67.118
-7.741
-10.34%
jan 1, 2012
56.748
-10.37
-15.45%
jan 1, 2013
59.042
+2.294
4.04%
jan 1, 2014
52.536
-6.506
-11.02%
Ranking of countries by current statistics by years


Comments: