29
/
en
AIzaSyAYiBZKx7MnpbEhh9jyipgxe19OcubqV5w
April 1, 2024
225789
Portugal
PRT
true
2
1
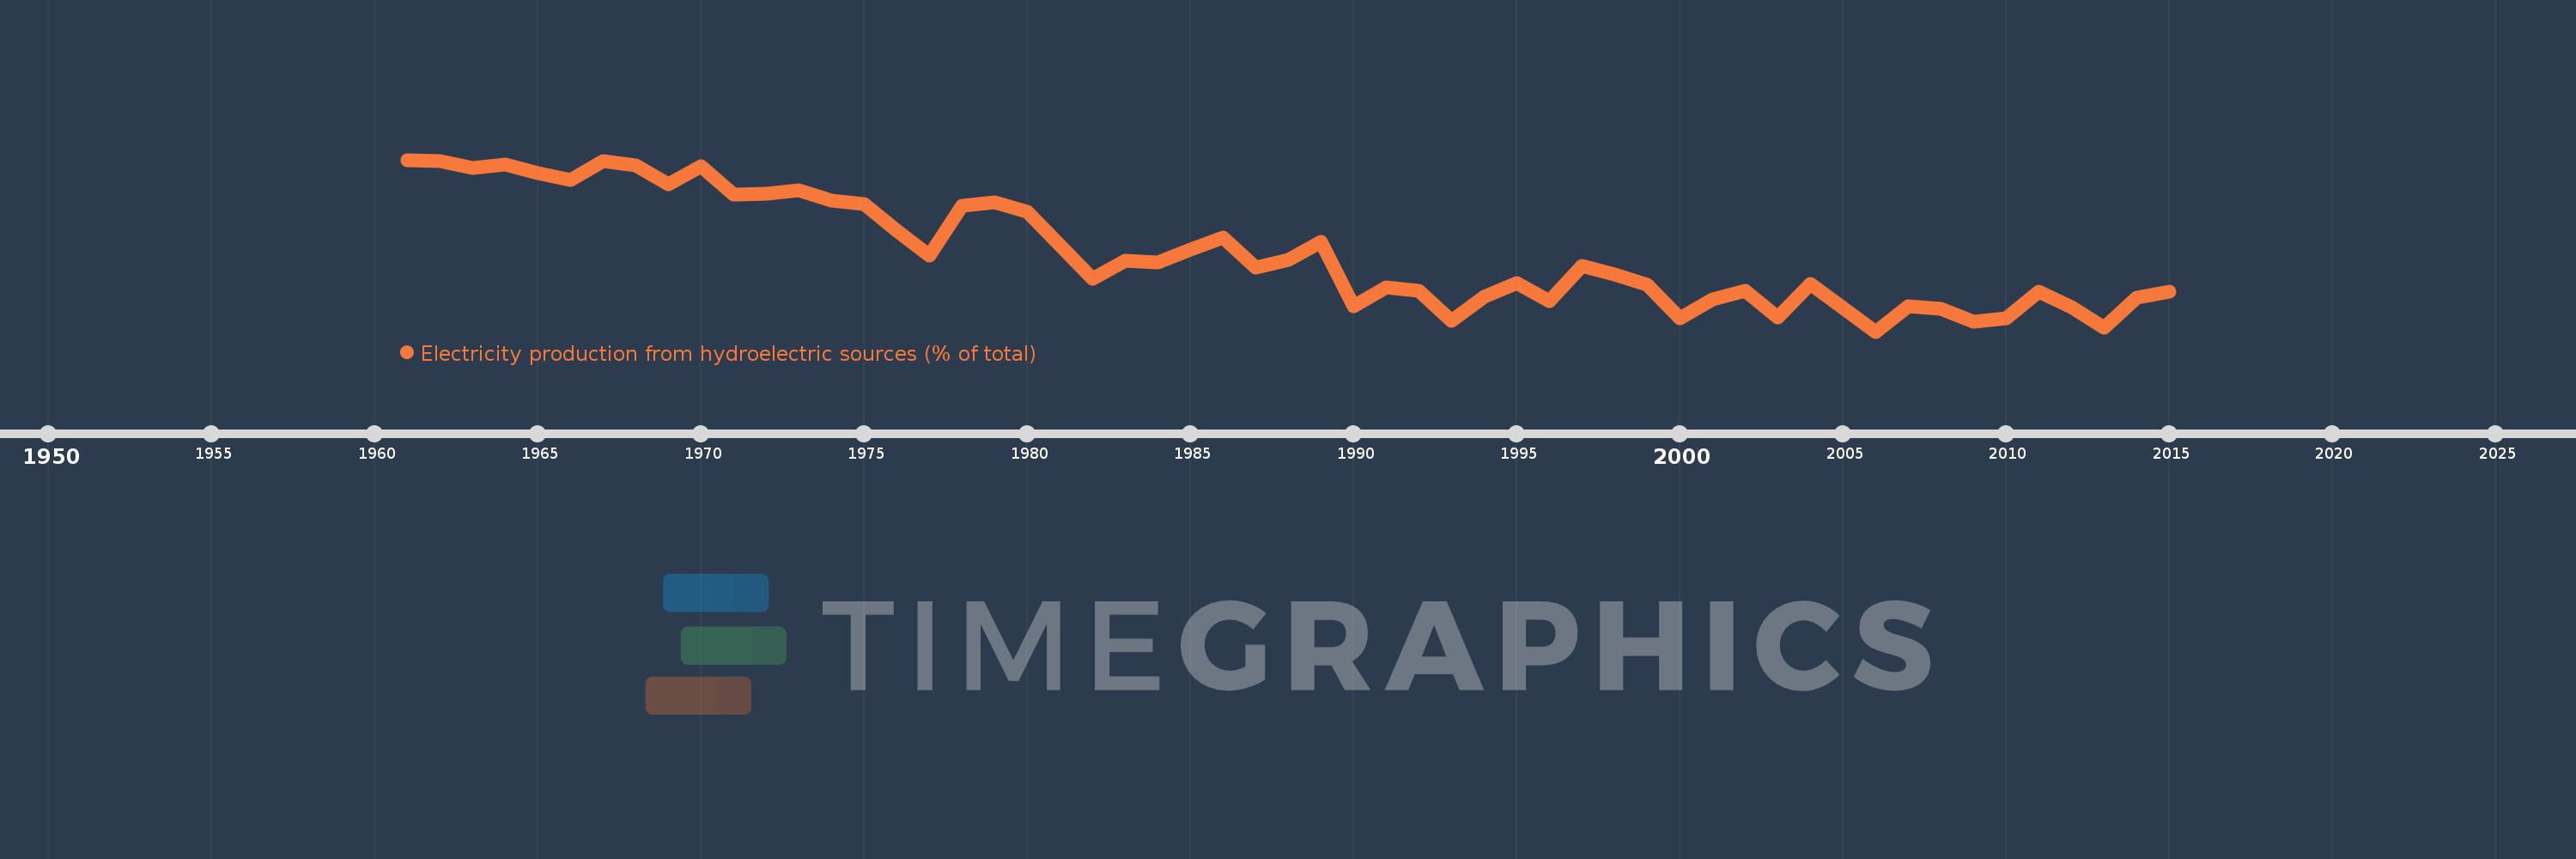
Electricity production from hydroelectric sources (% of total)
2015,2014,2013,2012,2011,2010,2009,2008,2007,2006,2005,2004,2003,2002,2001,2000,1999,1998,1997,1996,1995,1994,1993,1992,1991,1990,1989,1988,1987,1986,1985,1984,1983,1982,1981,1980,1979,1978,1977,1976,1975,1974,1973,1972,1971,1970,1969,1968,1967,1966,1965,1964,1963,1962,1961
This statistics in other country:
AlbaniaAlgeriaAngolaArab WorldArgentinaArmeniaAustraliaAustriaAzerbaijanBahrainBangladeshBelarusBelgiumBeninBoliviaBosnia and HerzegovinaBotswanaBrazilBrunei DarussalamBulgariaCambodiaCameroonCanadaCentral Europe and the BalticsChileChinaColombiaCongo, Dem. Rep.Congo, Rep.Costa RicaCote d'IvoireCroatiaCubaCuracaoCyprusCzech RepublicDenmarkDominican RepublicEarly-demographic dividendEast Asia & PacificEast Asia & Pacific (excluding high income)East Asia & Pacific (IDA & IBRD countries)EcuadorEgypt, Arab Rep.El SalvadorEritreaEstoniaEthiopiaEuro areaEurope & Central AsiaEurope & Central Asia (excluding high income)Europe & Central Asia (IDA & IBRD countries)European UnionFinlandFragile and conflict affected situationsFranceGabonGeorgiaGermanyGhanaGibraltarGreeceGuatemalaHaitiHeavily indebted poor countries (HIPC)High incomeHondurasHong Kong SAR, ChinaHungaryIBRD onlyIcelandIDA & IBRD totalIDA blendIDA onlyIDA totalIndiaIndonesiaIran, Islamic Rep.IraqIrelandIsraelItalyJamaicaJapanJordanKazakhstanKenyaKorea, Dem. People’s Rep.Korea, Rep.KosovoKuwaitKyrgyz RepublicLate-demographic dividendLatin America & Caribbean Latin America & Caribbean (excluding high income)Latin America & the Caribbean (IDA & IBRD countries)LatviaLeast developed countries: UN classificationLebanonLibyaLithuaniaLow & middle incomeLower middle incomeLuxembourgMacedonia, FYRMalaysiaMaltaMauritiusMexicoMiddle East & North AfricaMiddle East & North Africa (excluding high income)Middle East & North Africa (IDA & IBRD countries)Middle incomeMoldovaMongoliaMontenegroMoroccoMozambiqueMyanmarNamibiaNepalNetherlandsNew ZealandNicaraguaNigerNigeriaNorth AmericaNorwayOECD membersOmanOther small statesPakistanPanamaParaguayPeruPhilippinesPolandPortugalPost-demographic dividendPre-demographic dividendQatarRomaniaRussian FederationSaudi ArabiaSenegalSerbiaSingaporeSlovak RepublicSloveniaSmall statesSouth AfricaSouth AsiaSouth Asia (IDA & IBRD)South SudanSpainSri LankaSub-Saharan Africa Sub-Saharan Africa (excluding high income)Sub-Saharan Africa (IDA & IBRD countries)SudanSwedenSwitzerlandSyrian Arab RepublicTajikistanTanzaniaThailandTogoTrinidad and TobagoTunisiaTurkeyTurkmenistanUkraineUnited Arab EmiratesUnited KingdomUnited StatesUpper middle incomeUruguayUzbekistanVenezuela, RBVietnamWorldYemen, Rep.ZambiaZimbabwe Timeline:
This timeline shows a graph from 1961 to 2015 of Portugal. No data until 1960. Number of actual observations by date: 55.
Source name:
World Development Indicators
Source organization:
IEA Statistics © OECD/IEA 2014 (http://www.iea.org/stats/index.asp), subject to https://www.iea.org/t&c/termsandconditions/
Categories, topics:
Energy & Mining, Climate Change, Infrastructure
Last updated:
apr 23, 2017
Indicators value changes by year
Minimum:
10.243
jan 1, 2006
At the date of observation
Value
Absolute change
Change from previous value
jan 1, 1961
95.09
+95.09
0.0%
jan 1, 1962
94.481
-0.609
-0.64%
jan 1, 1963
91.193
-3.288
-3.48%
jan 1, 1964
92.66
+1.467
1.61%
jan 1, 1965
88.343
-4.317
-4.66%
jan 1, 1966
85.227
-3.115
-3.53%
jan 1, 1967
94.535
+9.308
10.92%
jan 1, 1968
92.18
-2.355
-2.49%
jan 1, 1969
83.061
-9.118
-9.89%
jan 1, 1970
92.051
+8.99
10.82%
jan 1, 1971
78.032
-14.019
-15.23%
jan 1, 1972
78.141
+0.109
0.14%
jan 1, 1973
80.158
+2.018
2.58%
jan 1, 1974
74.806
-5.352
-6.68%
jan 1, 1975
73.262
-1.544
-2.06%
jan 1, 1976
59.901
-13.361
-18.24%
jan 1, 1977
47.651
-12.25
-20.45%
jan 1, 1978
72.348
+24.698
51.83%
jan 1, 1979
74.053
+1.705
2.36%
jan 1, 1980
69.581
-4.472
-6.04%
jan 1, 1981
52.709
-16.872
-24.25%
jan 1, 1982
36.306
-16.403
-31.12%
jan 1, 1983
45.067
+8.761
24.13%
jan 1, 1984
44.458
-0.609
-1.35%
jan 1, 1985
50.873
+6.415
14.43%
jan 1, 1986
56.847
+5.975
11.74%
jan 1, 1987
41.885
-14.962
-26.32%
jan 1, 1988
45.531
+3.645
8.7%
jan 1, 1989
54.563
+9.032
19.84%
jan 1, 1990
22.776
-31.787
-58.26%
jan 1, 1991
32.294
+9.518
41.79%
jan 1, 1992
30.408
-1.886
-5.84%
jan 1, 1993
15.664
-14.744
-48.49%
jan 1, 1994
27.536
+11.872
75.79%
jan 1, 1995
34.01
+6.474
23.51%
jan 1, 1996
25.164
-8.845
-26.01%
jan 1, 1997
42.879
+17.714
70.39%
jan 1, 1998
38.388
-4.49
-10.47%
jan 1, 1999
33.364
-5.024
-13.09%
jan 1, 2000
16.967
-16.397
-49.15%
jan 1, 2001
26.107
+9.14
53.87%
jan 1, 2002
30.398
+4.291
16.44%
jan 1, 2003
17.087
-13.311
-43.79%
jan 1, 2004
33.798
+16.711
97.8%
jan 1, 2005
22.016
-11.782
-34.86%
jan 1, 2006
10.243
-11.773
-53.47%
jan 1, 2007
22.649
+12.406
121.12%
jan 1, 2008
21.52
-1.129
-4.99%
jan 1, 2009
14.95
-6.57
-30.53%
jan 1, 2010
16.741
+1.791
11.98%
jan 1, 2011
30.076
+13.334
79.65%
jan 1, 2012
22.24
-7.836
-26.05%
jan 1, 2013
12.335
-9.905
-44.54%
jan 1, 2014
27.17
+14.834
120.26%
jan 1, 2015
29.998
+2.828
10.41%
Ranking of countries by current statistics by years


Comments: