29
/
en
AIzaSyAYiBZKx7MnpbEhh9jyipgxe19OcubqV5w
April 1, 2024
44991
Low & middle income
LMY
false
2
1
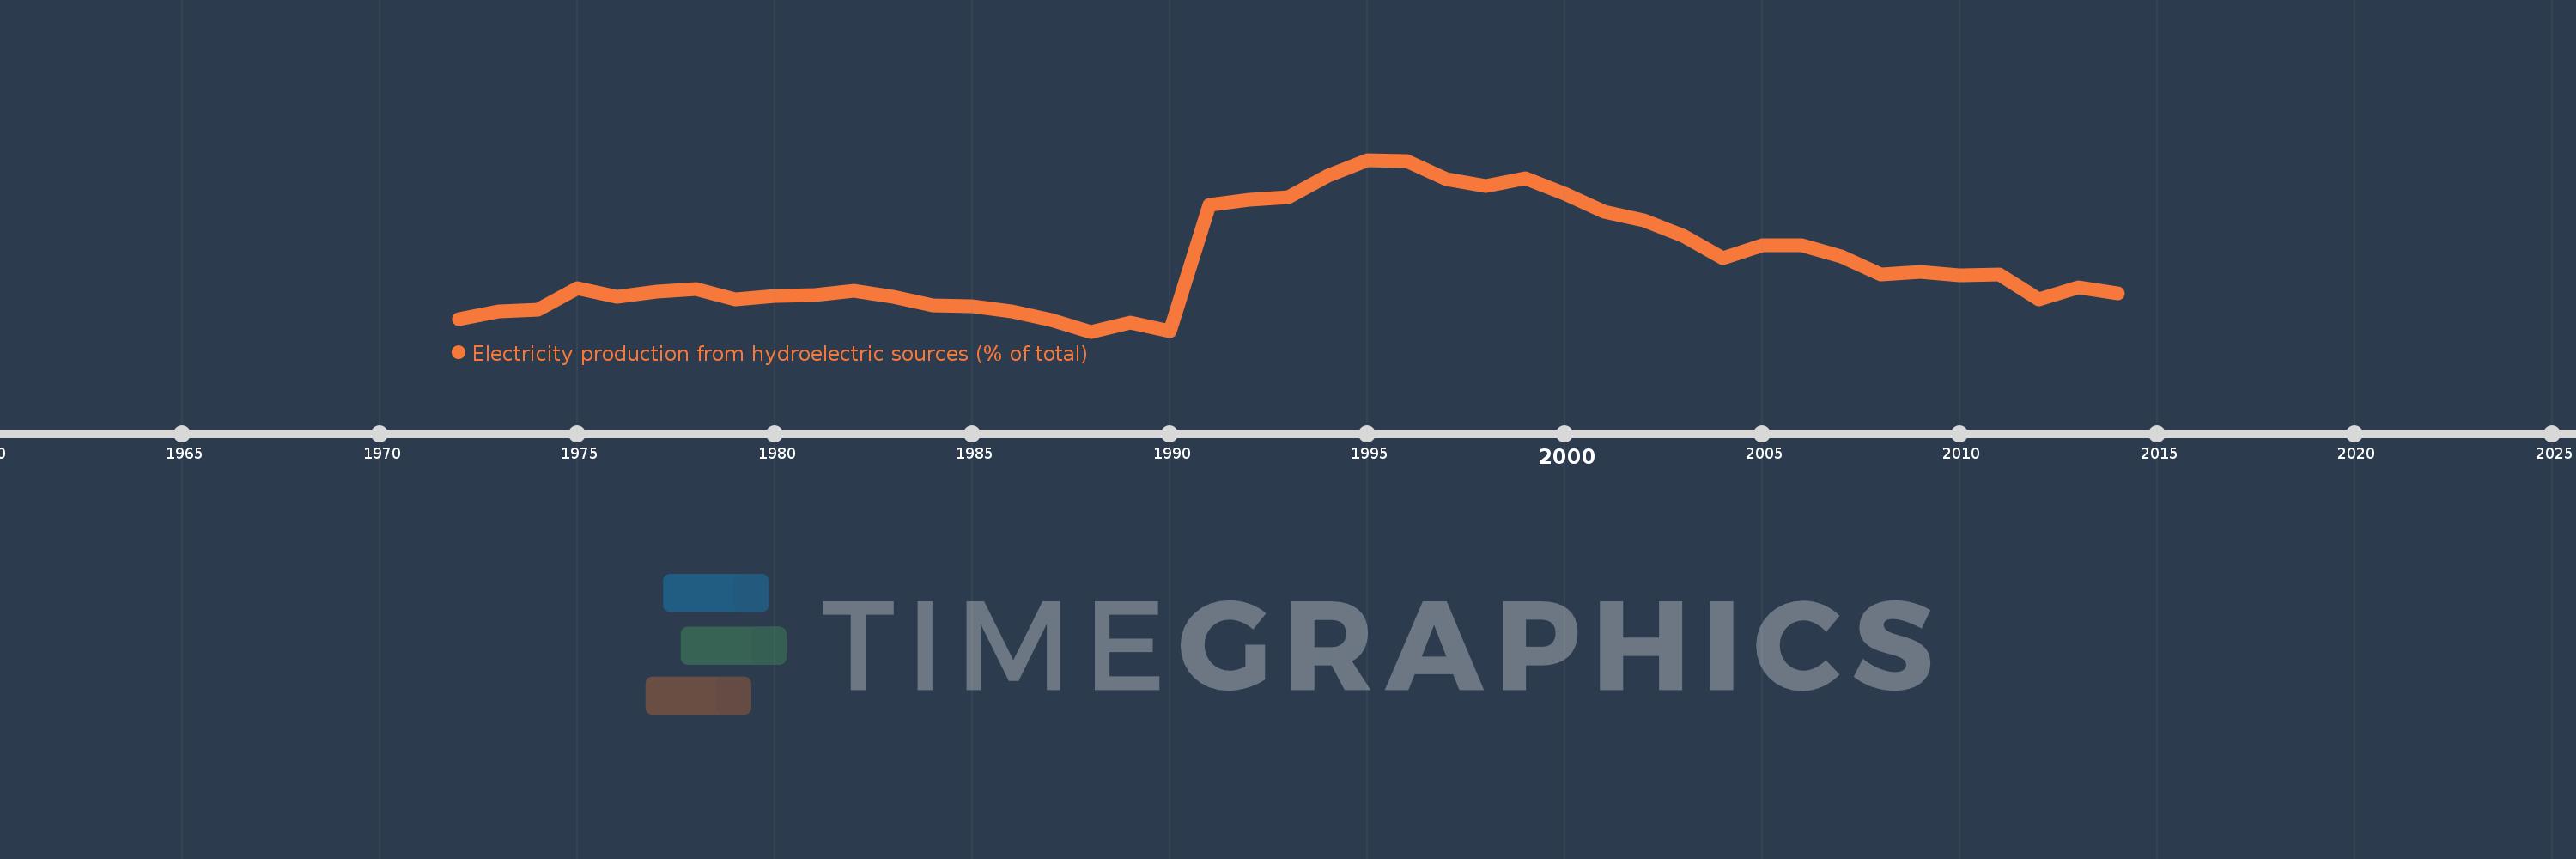
Electricity production from hydroelectric sources (% of total)
2014,2013,2012,2011,2010,2009,2008,2007,2006,2005,2004,2003,2002,2001,2000,1999,1998,1997,1996,1995,1994,1993,1992,1991,1990,1989,1988,1987,1986,1985,1984,1983,1982,1981,1980,1979,1978,1977,1976,1975,1974,1973,1972
This statistics in other country:
AlbaniaAlgeriaAngolaArab WorldArgentinaArmeniaAustraliaAustriaAzerbaijanBahrainBangladeshBelarusBelgiumBeninBoliviaBosnia and HerzegovinaBotswanaBrazilBrunei DarussalamBulgariaCambodiaCameroonCanadaCentral Europe and the BalticsChileChinaColombiaCongo, Dem. Rep.Congo, Rep.Costa RicaCote d'IvoireCroatiaCubaCuracaoCyprusCzech RepublicDenmarkDominican RepublicEarly-demographic dividendEast Asia & PacificEast Asia & Pacific (excluding high income)East Asia & Pacific (IDA & IBRD countries)EcuadorEgypt, Arab Rep.El SalvadorEritreaEstoniaEthiopiaEuro areaEurope & Central AsiaEurope & Central Asia (excluding high income)Europe & Central Asia (IDA & IBRD countries)European UnionFinlandFragile and conflict affected situationsFranceGabonGeorgiaGermanyGhanaGibraltarGreeceGuatemalaHaitiHeavily indebted poor countries (HIPC)High incomeHondurasHong Kong SAR, ChinaHungaryIBRD onlyIcelandIDA & IBRD totalIDA blendIDA onlyIDA totalIndiaIndonesiaIran, Islamic Rep.IraqIrelandIsraelItalyJamaicaJapanJordanKazakhstanKenyaKorea, Dem. People’s Rep.Korea, Rep.KosovoKuwaitKyrgyz RepublicLate-demographic dividendLatin America & Caribbean Latin America & Caribbean (excluding high income)Latin America & the Caribbean (IDA & IBRD countries)LatviaLeast developed countries: UN classificationLebanonLibyaLithuaniaLow & middle incomeLower middle incomeLuxembourgMacedonia, FYRMalaysiaMaltaMauritiusMexicoMiddle East & North AfricaMiddle East & North Africa (excluding high income)Middle East & North Africa (IDA & IBRD countries)Middle incomeMoldovaMongoliaMontenegroMoroccoMozambiqueMyanmarNamibiaNepalNetherlandsNew ZealandNicaraguaNigerNigeriaNorth AmericaNorwayOECD membersOmanOther small statesPakistanPanamaParaguayPeruPhilippinesPolandPortugalPost-demographic dividendPre-demographic dividendQatarRomaniaRussian FederationSaudi ArabiaSenegalSerbiaSingaporeSlovak RepublicSloveniaSmall statesSouth AfricaSouth AsiaSouth Asia (IDA & IBRD)South SudanSpainSri LankaSub-Saharan Africa Sub-Saharan Africa (excluding high income)Sub-Saharan Africa (IDA & IBRD countries)SudanSwedenSwitzerlandSyrian Arab RepublicTajikistanTanzaniaThailandTogoTrinidad and TobagoTunisiaTurkeyTurkmenistanUkraineUnited Arab EmiratesUnited KingdomUnited StatesUpper middle incomeUruguayUzbekistanVenezuela, RBVietnamWorldYemen, Rep.ZambiaZimbabwe Timeline:
This timeline shows a graph from 1972 to 2014 of Low & middle income. No data until 1971. Number of actual observations by date: 43.
Source name:
World Development Indicators
Source organization:
IEA Statistics © OECD/IEA 2014 (http://www.iea.org/stats/index.asp), subject to https://www.iea.org/t&c/termsandconditions/
Categories, topics:
Energy & Mining, Climate Change, Infrastructure
Last updated:
apr 23, 2017
Indicators value changes by year
Minimum:
18.098
jan 1, 1988
Maximum:
26.215
jan 1, 1995
At the date of observation
Value
Absolute change
Change from previous value
jan 1, 1972
18.675
+18.675
0.0%
jan 1, 1973
19.047
+0.372
1.99%
jan 1, 1974
19.135
+0.088
0.46%
jan 1, 1975
20.143
+1.008
5.27%
jan 1, 1976
19.743
-0.4
-1.99%
jan 1, 1977
19.971
+0.228
1.15%
jan 1, 1978
20.103
+0.132
0.66%
jan 1, 1979
19.606
-0.498
-2.47%
jan 1, 1980
19.801
+0.196
1.0%
jan 1, 1981
19.815
+0.013
0.07%
jan 1, 1982
20.008
+0.193
0.97%
jan 1, 1983
19.737
-0.271
-1.35%
jan 1, 1984
19.33
-0.407
-2.06%
jan 1, 1985
19.298
-0.031
-0.16%
jan 1, 1986
19.062
-0.236
-1.22%
jan 1, 1987
18.661
-0.401
-2.1%
jan 1, 1988
18.098
-0.563
-3.02%
jan 1, 1989
18.509
+0.411
2.27%
jan 1, 1990
18.102
-0.406
-2.2%
jan 1, 1991
24.082
+5.98
33.03%
jan 1, 1992
24.345
+0.262
1.09%
jan 1, 1993
24.442
+0.097
0.4%
jan 1, 1994
25.47
+1.028
4.21%
jan 1, 1995
26.215
+0.745
2.93%
jan 1, 1996
26.155
-0.06
-0.23%
jan 1, 1997
25.294
-0.861
-3.29%
jan 1, 1998
24.992
-0.301
-1.19%
jan 1, 1999
25.36
+0.368
1.47%
jan 1, 2000
24.601
-0.759
-2.99%
jan 1, 2001
23.771
-0.83
-3.37%
jan 1, 2002
23.334
-0.436
-1.84%
jan 1, 2003
22.64
-0.694
-2.97%
jan 1, 2004
21.558
-1.082
-4.78%
jan 1, 2005
22.174
+0.616
2.86%
jan 1, 2006
22.178
+0.004
0.02%
jan 1, 2007
21.661
-0.517
-2.33%
jan 1, 2008
20.791
-0.87
-4.02%
jan 1, 2009
20.92
+0.129
0.62%
jan 1, 2010
20.761
-0.158
-0.76%
jan 1, 2011
20.779
+0.018
0.09%
jan 1, 2012
19.631
-1.148
-5.53%
jan 1, 2013
20.199
+0.567
2.89%
jan 1, 2014
19.885
-0.314
-1.55%
Ranking of countries by current statistics by years


Comments: