29
/
en
AIzaSyAYiBZKx7MnpbEhh9jyipgxe19OcubqV5w
April 1, 2024
218212
Panama
PAN
true
2
1
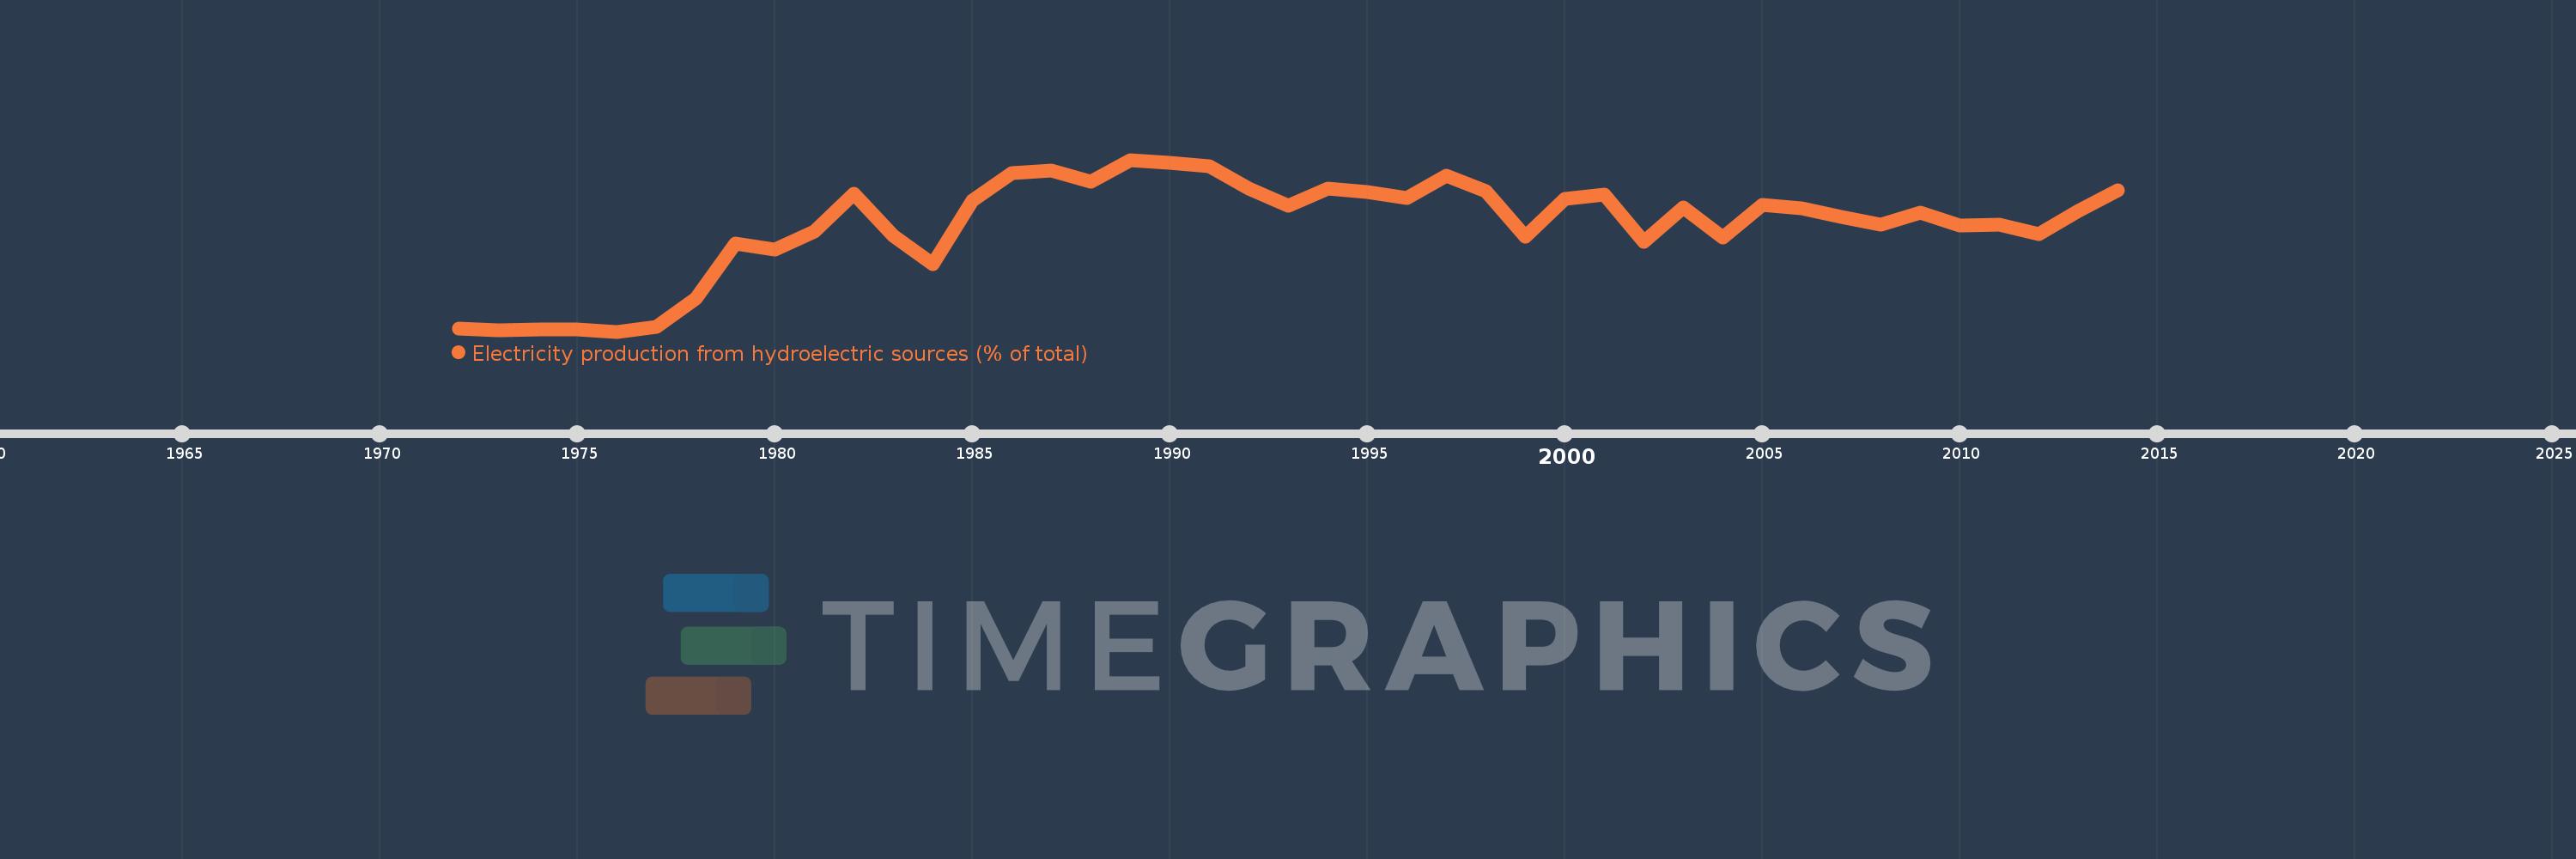
Electricity production from hydroelectric sources (% of total)
2014,2013,2012,2011,2010,2009,2008,2007,2006,2005,2004,2003,2002,2001,2000,1999,1998,1997,1996,1995,1994,1993,1992,1991,1990,1989,1988,1987,1986,1985,1984,1983,1982,1981,1980,1979,1978,1977,1976,1975,1974,1973,1972
This statistics in other country:
AlbaniaAlgeriaAngolaArab WorldArgentinaArmeniaAustraliaAustriaAzerbaijanBahrainBangladeshBelarusBelgiumBeninBoliviaBosnia and HerzegovinaBotswanaBrazilBrunei DarussalamBulgariaCambodiaCameroonCanadaCentral Europe and the BalticsChileChinaColombiaCongo, Dem. Rep.Congo, Rep.Costa RicaCote d'IvoireCroatiaCubaCuracaoCyprusCzech RepublicDenmarkDominican RepublicEarly-demographic dividendEast Asia & PacificEast Asia & Pacific (excluding high income)East Asia & Pacific (IDA & IBRD countries)EcuadorEgypt, Arab Rep.El SalvadorEritreaEstoniaEthiopiaEuro areaEurope & Central AsiaEurope & Central Asia (excluding high income)Europe & Central Asia (IDA & IBRD countries)European UnionFinlandFragile and conflict affected situationsFranceGabonGeorgiaGermanyGhanaGibraltarGreeceGuatemalaHaitiHeavily indebted poor countries (HIPC)High incomeHondurasHong Kong SAR, ChinaHungaryIBRD onlyIcelandIDA & IBRD totalIDA blendIDA onlyIDA totalIndiaIndonesiaIran, Islamic Rep.IraqIrelandIsraelItalyJamaicaJapanJordanKazakhstanKenyaKorea, Dem. People’s Rep.Korea, Rep.KosovoKuwaitKyrgyz RepublicLate-demographic dividendLatin America & Caribbean Latin America & Caribbean (excluding high income)Latin America & the Caribbean (IDA & IBRD countries)LatviaLeast developed countries: UN classificationLebanonLibyaLithuaniaLow & middle incomeLower middle incomeLuxembourgMacedonia, FYRMalaysiaMaltaMauritiusMexicoMiddle East & North AfricaMiddle East & North Africa (excluding high income)Middle East & North Africa (IDA & IBRD countries)Middle incomeMoldovaMongoliaMontenegroMoroccoMozambiqueMyanmarNamibiaNepalNetherlandsNew ZealandNicaraguaNigerNigeriaNorth AmericaNorwayOECD membersOmanOther small statesPakistanPanamaParaguayPeruPhilippinesPolandPortugalPost-demographic dividendPre-demographic dividendQatarRomaniaRussian FederationSaudi ArabiaSenegalSerbiaSingaporeSlovak RepublicSloveniaSmall statesSouth AfricaSouth AsiaSouth Asia (IDA & IBRD)South SudanSpainSri LankaSub-Saharan Africa Sub-Saharan Africa (excluding high income)Sub-Saharan Africa (IDA & IBRD countries)SudanSwedenSwitzerlandSyrian Arab RepublicTajikistanTanzaniaThailandTogoTrinidad and TobagoTunisiaTurkeyTurkmenistanUkraineUnited Arab EmiratesUnited KingdomUnited StatesUpper middle incomeUruguayUzbekistanVenezuela, RBVietnamWorldYemen, Rep.ZambiaZimbabwe Timeline:
This timeline shows a graph from 1972 to 2014 of Panama. No data until 1971. Number of actual observations by date: 43.
Source name:
World Development Indicators
Source organization:
IEA Statistics © OECD/IEA 2014 (http://www.iea.org/stats/index.asp), subject to https://www.iea.org/t&c/termsandconditions/
Categories, topics:
Energy & Mining, Climate Change, Infrastructure
Last updated:
apr 23, 2017
Indicators value changes by year
Maximum:
85.932
jan 1, 1989
At the date of observation
Value
Absolute change
Change from previous value
jan 1, 1972
9.232
+9.232
0.0%
jan 1, 1973
8.242
-0.99
-10.72%
jan 1, 1974
8.651
+0.409
4.96%
jan 1, 1975
8.841
+0.189
2.19%
jan 1, 1976
7.834
-1.007
-11.39%
jan 1, 1977
9.801
+1.967
25.11%
jan 1, 1978
22.932
+13.131
133.97%
jan 1, 1979
47.87
+24.937
108.74%
jan 1, 1980
45.239
-2.63
-5.49%
jan 1, 1981
53.201
+7.961
17.6%
jan 1, 1982
70.322
+17.121
32.18%
jan 1, 1983
51.437
-18.885
-26.85%
jan 1, 1984
38.678
-12.759
-24.8%
jan 1, 1985
67.481
+28.803
74.47%
jan 1, 1986
79.711
+12.23
18.12%
jan 1, 1987
81.02
+1.31
1.64%
jan 1, 1988
76.076
-4.944
-6.1%
jan 1, 1989
85.932
+9.856
12.95%
jan 1, 1990
84.535
-1.397
-1.63%
jan 1, 1991
83.164
-1.371
-1.62%
jan 1, 1992
72.975
-10.189
-12.25%
jan 1, 1993
65.14
-7.835
-10.74%
jan 1, 1994
72.927
+7.787
11.95%
jan 1, 1995
71.14
-1.787
-2.45%
jan 1, 1996
68.713
-2.427
-3.41%
jan 1, 1997
78.53
+9.818
14.29%
jan 1, 1998
71.661
-6.869
-8.75%
jan 1, 1999
51.062
-20.6
-28.75%
jan 1, 2000
68.231
+17.17
33.63%
jan 1, 2001
69.941
+1.709
2.51%
jan 1, 2002
48.77
-21.17
-30.27%
jan 1, 2003
64.255
+15.484
31.75%
jan 1, 2004
50.628
-13.627
-21.21%
jan 1, 2005
65.596
+14.969
29.57%
jan 1, 2006
63.909
-1.687
-2.57%
jan 1, 2007
59.776
-4.133
-6.47%
jan 1, 2008
56.618
-3.158
-5.28%
jan 1, 2009
61.802
+5.184
9.16%
jan 1, 2010
56.048
-5.754
-9.31%
jan 1, 2011
56.531
+0.483
0.86%
jan 1, 2012
52.157
-4.373
-7.74%
jan 1, 2013
62.607
+10.45
20.04%
jan 1, 2014
71.925
+9.317
14.88%
Ranking of countries by current statistics by years


Comments: