29
/
en
AIzaSyAYiBZKx7MnpbEhh9jyipgxe19OcubqV5w
April 1, 2024
260770
Tanzania
TZA
true
2
1
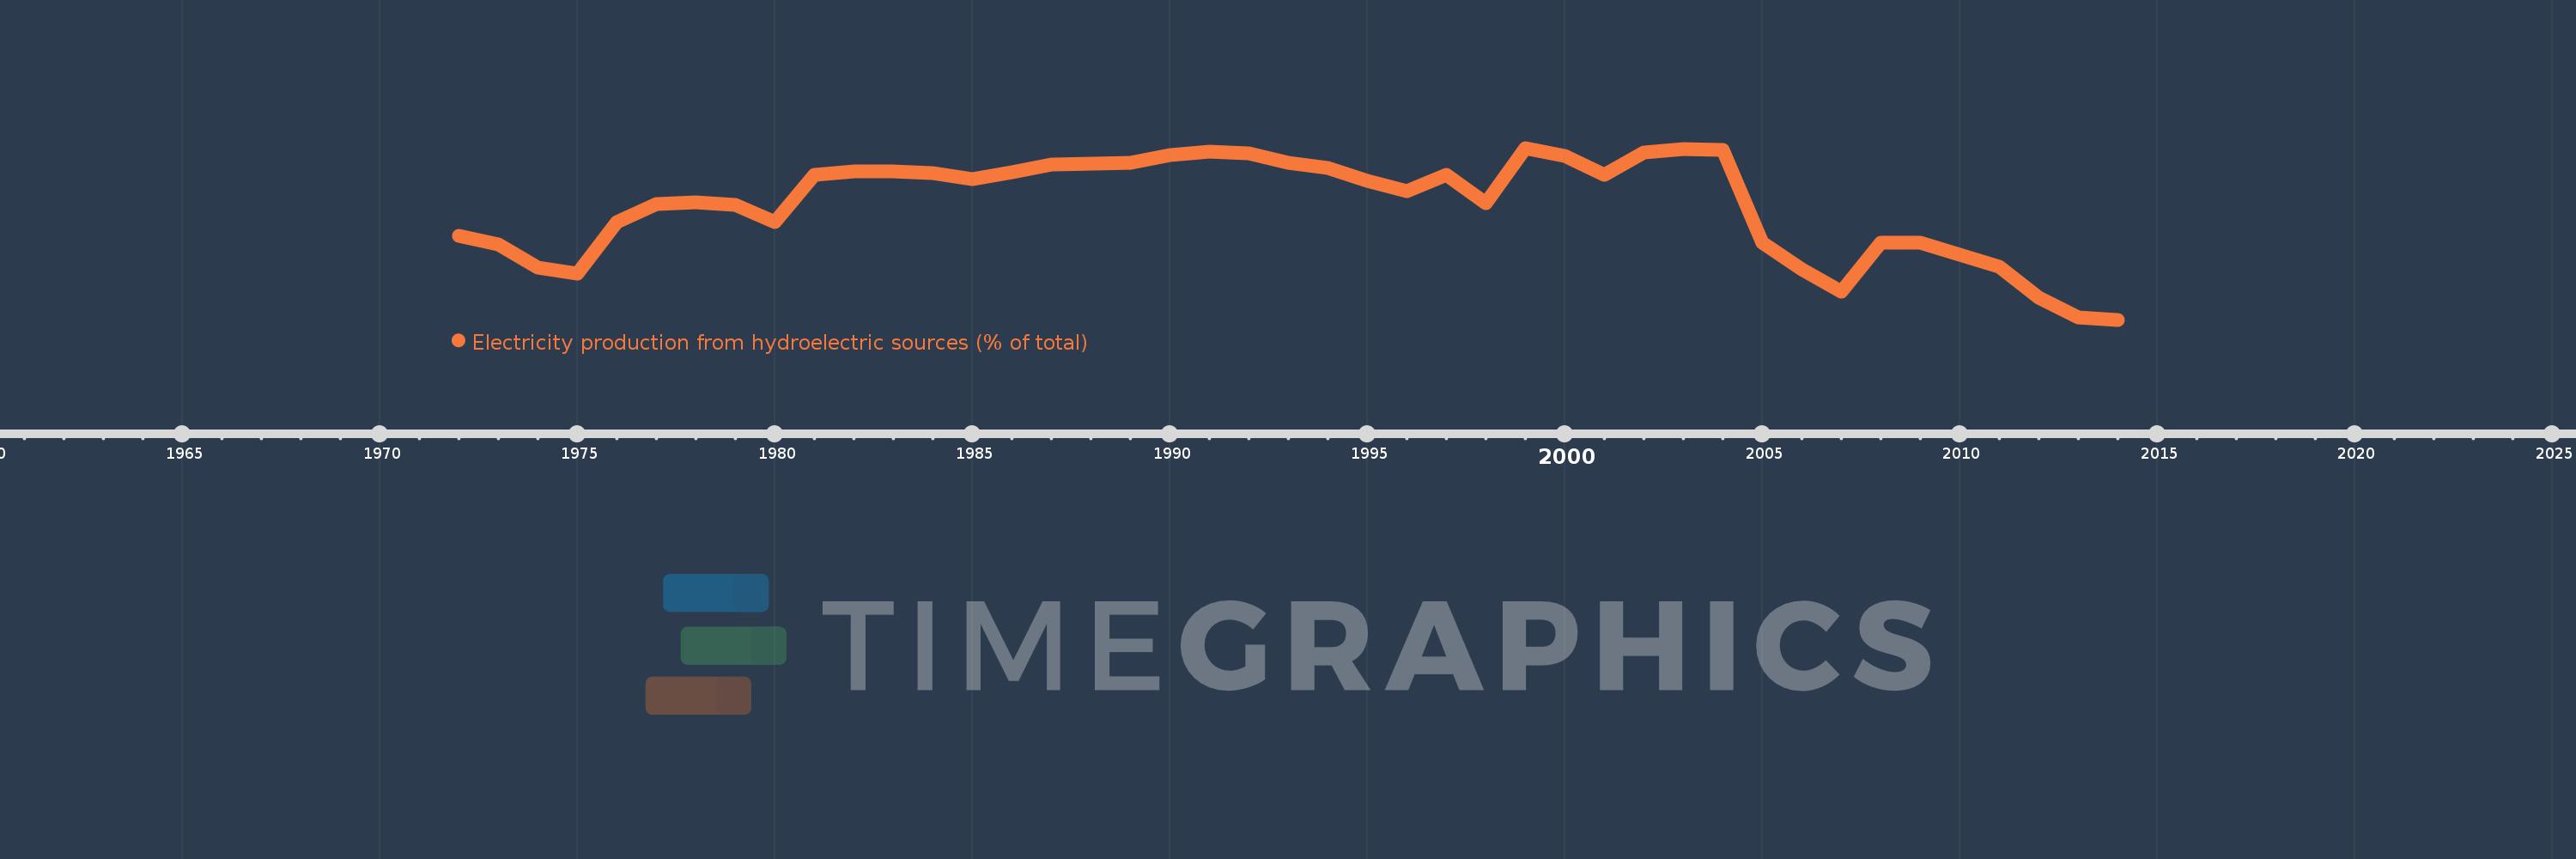
Electricity production from hydroelectric sources (% of total)
2014,2013,2012,2011,2010,2009,2008,2007,2006,2005,2004,2003,2002,2001,2000,1999,1998,1997,1996,1995,1994,1993,1992,1991,1990,1989,1988,1987,1986,1985,1984,1983,1982,1981,1980,1979,1978,1977,1976,1975,1974,1973,1972
This statistics in other country:
AlbaniaAlgeriaAngolaArab WorldArgentinaArmeniaAustraliaAustriaAzerbaijanBahrainBangladeshBelarusBelgiumBeninBoliviaBosnia and HerzegovinaBotswanaBrazilBrunei DarussalamBulgariaCambodiaCameroonCanadaCentral Europe and the BalticsChileChinaColombiaCongo, Dem. Rep.Congo, Rep.Costa RicaCote d'IvoireCroatiaCubaCuracaoCyprusCzech RepublicDenmarkDominican RepublicEarly-demographic dividendEast Asia & PacificEast Asia & Pacific (excluding high income)East Asia & Pacific (IDA & IBRD countries)EcuadorEgypt, Arab Rep.El SalvadorEritreaEstoniaEthiopiaEuro areaEurope & Central AsiaEurope & Central Asia (excluding high income)Europe & Central Asia (IDA & IBRD countries)European UnionFinlandFragile and conflict affected situationsFranceGabonGeorgiaGermanyGhanaGibraltarGreeceGuatemalaHaitiHeavily indebted poor countries (HIPC)High incomeHondurasHong Kong SAR, ChinaHungaryIBRD onlyIcelandIDA & IBRD totalIDA blendIDA onlyIDA totalIndiaIndonesiaIran, Islamic Rep.IraqIrelandIsraelItalyJamaicaJapanJordanKazakhstanKenyaKorea, Dem. People’s Rep.Korea, Rep.KosovoKuwaitKyrgyz RepublicLate-demographic dividendLatin America & Caribbean Latin America & Caribbean (excluding high income)Latin America & the Caribbean (IDA & IBRD countries)LatviaLeast developed countries: UN classificationLebanonLibyaLithuaniaLow & middle incomeLower middle incomeLuxembourgMacedonia, FYRMalaysiaMaltaMauritiusMexicoMiddle East & North AfricaMiddle East & North Africa (excluding high income)Middle East & North Africa (IDA & IBRD countries)Middle incomeMoldovaMongoliaMontenegroMoroccoMozambiqueMyanmarNamibiaNepalNetherlandsNew ZealandNicaraguaNigerNigeriaNorth AmericaNorwayOECD membersOmanOther small statesPakistanPanamaParaguayPeruPhilippinesPolandPortugalPost-demographic dividendPre-demographic dividendQatarRomaniaRussian FederationSaudi ArabiaSenegalSerbiaSingaporeSlovak RepublicSloveniaSmall statesSouth AfricaSouth AsiaSouth Asia (IDA & IBRD)South SudanSpainSri LankaSub-Saharan Africa Sub-Saharan Africa (excluding high income)Sub-Saharan Africa (IDA & IBRD countries)SudanSwedenSwitzerlandSyrian Arab RepublicTajikistanTanzaniaThailandTogoTrinidad and TobagoTunisiaTurkeyTurkmenistanUkraineUnited Arab EmiratesUnited KingdomUnited StatesUpper middle incomeUruguayUzbekistanVenezuela, RBVietnamWorldYemen, Rep.ZambiaZimbabwe Timeline:
This timeline shows a graph from 1972 to 2014 of Tanzania. No data until 1971. Number of actual observations by date: 43.
Source name:
World Development Indicators
Source organization:
IEA Statistics © OECD/IEA 2014 (http://www.iea.org/stats/index.asp), subject to https://www.iea.org/t&c/termsandconditions/
Categories, topics:
Energy & Mining, Climate Change, Infrastructure
Last updated:
apr 23, 2017
Indicators value changes by year
Minimum:
30.804
jan 1, 2014
Maximum:
96.651
jan 1, 1999
At the date of observation
Value
Absolute change
Change from previous value
jan 1, 1972
62.933
+62.933
0.0%
jan 1, 1973
59.777
-3.156
-5.02%
jan 1, 1974
50.859
-8.917
-14.92%
jan 1, 1975
48.595
-2.264
-4.45%
jan 1, 1976
68.088
+19.493
40.11%
jan 1, 1977
75.075
+6.987
10.26%
jan 1, 1978
75.691
+0.616
0.82%
jan 1, 1979
74.82
-0.871
-1.15%
jan 1, 1980
68.359
-6.461
-8.64%
jan 1, 1981
86.364
+18.004
26.34%
jan 1, 1982
87.743
+1.379
1.6%
jan 1, 1983
87.59
-0.152
-0.17%
jan 1, 1984
87.044
-0.547
-0.62%
jan 1, 1985
84.816
-2.228
-2.56%
jan 1, 1986
87.192
+2.377
2.8%
jan 1, 1987
90.227
+3.035
3.48%
jan 1, 1988
90.487
+0.261
0.29%
jan 1, 1989
90.856
+0.369
0.41%
jan 1, 1990
94.036
+3.179
3.5%
jan 1, 1991
95.147
+1.112
1.18%
jan 1, 1992
94.731
-0.416
-0.44%
jan 1, 1993
90.859
-3.872
-4.09%
jan 1, 1994
88.848
-2.011
-2.21%
jan 1, 1995
84.166
-4.682
-5.27%
jan 1, 1996
79.99
-4.177
-4.96%
jan 1, 1997
86.278
+6.289
7.86%
jan 1, 1998
75.508
-10.77
-12.48%
jan 1, 1999
96.651
+21.143
28.0%
jan 1, 2000
93.715
-2.936
-3.04%
jan 1, 2001
86.367
-7.347
-7.84%
jan 1, 2002
94.794
+8.426
9.76%
jan 1, 2003
96.249
+1.456
1.54%
jan 1, 2004
95.863
-0.386
-0.4%
jan 1, 2005
60.246
-35.617
-37.15%
jan 1, 2006
50.014
-10.232
-16.98%
jan 1, 2007
41.647
-8.367
-16.73%
jan 1, 2008
60.325
+18.678
44.85%
jan 1, 2009
60.355
+0.03
0.05%
jan 1, 2010
55.684
-4.671
-7.74%
jan 1, 2011
51.214
-4.471
-8.03%
jan 1, 2012
39.132
-12.081
-23.59%
jan 1, 2013
31.616
-7.516
-19.21%
jan 1, 2014
30.804
-0.812
-2.57%
Ranking of countries by current statistics by years


Comments: