29
/
en
AIzaSyAYiBZKx7MnpbEhh9jyipgxe19OcubqV5w
April 1, 2024
141698
Greece
GRC
true
2
1
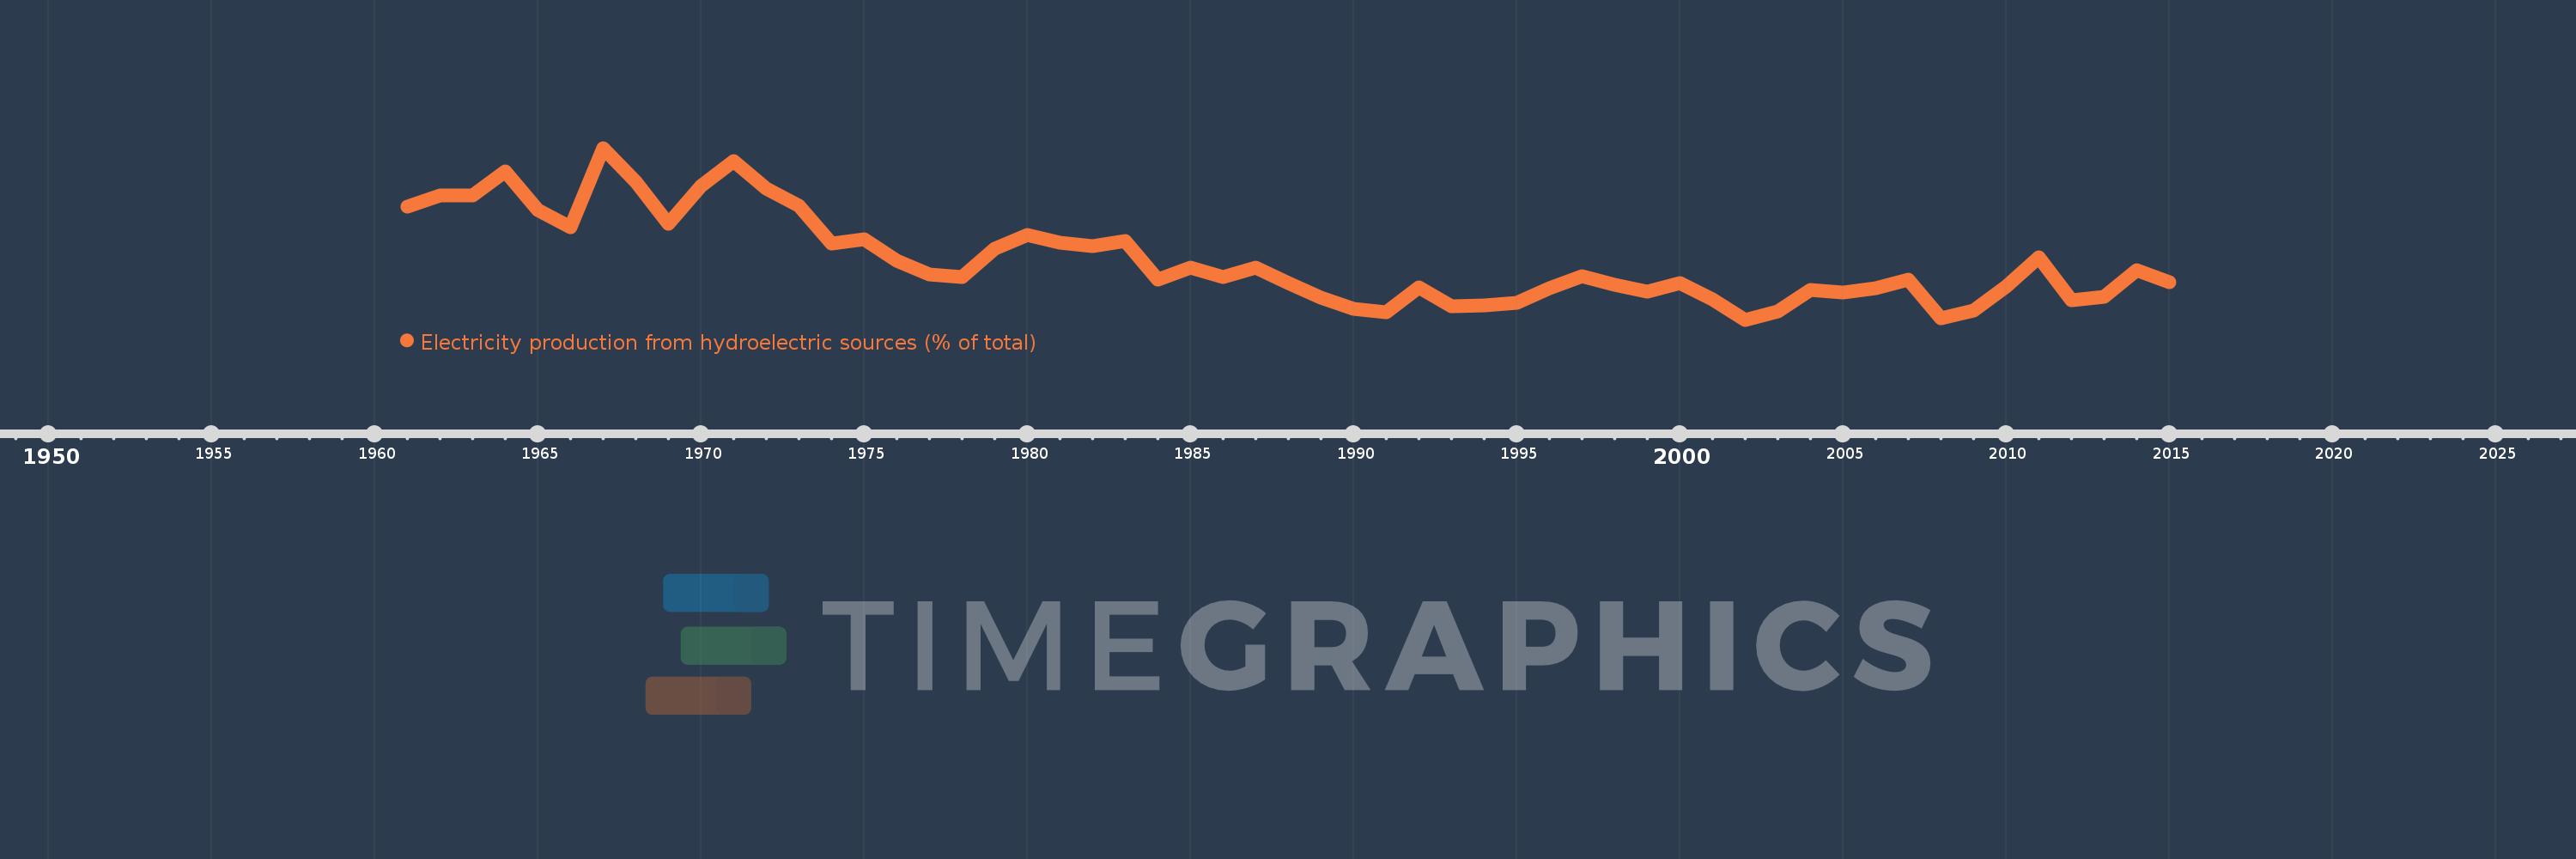
Electricity production from hydroelectric sources (% of total)
2015,2014,2013,2012,2011,2010,2009,2008,2007,2006,2005,2004,2003,2002,2001,2000,1999,1998,1997,1996,1995,1994,1993,1992,1991,1990,1989,1988,1987,1986,1985,1984,1983,1982,1981,1980,1979,1978,1977,1976,1975,1974,1973,1972,1971,1970,1969,1968,1967,1966,1965,1964,1963,1962,1961
This statistics in other country:
AlbaniaAlgeriaAngolaArab WorldArgentinaArmeniaAustraliaAustriaAzerbaijanBahrainBangladeshBelarusBelgiumBeninBoliviaBosnia and HerzegovinaBotswanaBrazilBrunei DarussalamBulgariaCambodiaCameroonCanadaCentral Europe and the BalticsChileChinaColombiaCongo, Dem. Rep.Congo, Rep.Costa RicaCote d'IvoireCroatiaCubaCuracaoCyprusCzech RepublicDenmarkDominican RepublicEarly-demographic dividendEast Asia & PacificEast Asia & Pacific (excluding high income)East Asia & Pacific (IDA & IBRD countries)EcuadorEgypt, Arab Rep.El SalvadorEritreaEstoniaEthiopiaEuro areaEurope & Central AsiaEurope & Central Asia (excluding high income)Europe & Central Asia (IDA & IBRD countries)European UnionFinlandFragile and conflict affected situationsFranceGabonGeorgiaGermanyGhanaGibraltarGreeceGuatemalaHaitiHeavily indebted poor countries (HIPC)High incomeHondurasHong Kong SAR, ChinaHungaryIBRD onlyIcelandIDA & IBRD totalIDA blendIDA onlyIDA totalIndiaIndonesiaIran, Islamic Rep.IraqIrelandIsraelItalyJamaicaJapanJordanKazakhstanKenyaKorea, Dem. People’s Rep.Korea, Rep.KosovoKuwaitKyrgyz RepublicLate-demographic dividendLatin America & Caribbean Latin America & Caribbean (excluding high income)Latin America & the Caribbean (IDA & IBRD countries)LatviaLeast developed countries: UN classificationLebanonLibyaLithuaniaLow & middle incomeLower middle incomeLuxembourgMacedonia, FYRMalaysiaMaltaMauritiusMexicoMiddle East & North AfricaMiddle East & North Africa (excluding high income)Middle East & North Africa (IDA & IBRD countries)Middle incomeMoldovaMongoliaMontenegroMoroccoMozambiqueMyanmarNamibiaNepalNetherlandsNew ZealandNicaraguaNigerNigeriaNorth AmericaNorwayOECD membersOmanOther small statesPakistanPanamaParaguayPeruPhilippinesPolandPortugalPost-demographic dividendPre-demographic dividendQatarRomaniaRussian FederationSaudi ArabiaSenegalSerbiaSingaporeSlovak RepublicSloveniaSmall statesSouth AfricaSouth AsiaSouth Asia (IDA & IBRD)South SudanSpainSri LankaSub-Saharan Africa Sub-Saharan Africa (excluding high income)Sub-Saharan Africa (IDA & IBRD countries)SudanSwedenSwitzerlandSyrian Arab RepublicTajikistanTanzaniaThailandTogoTrinidad and TobagoTunisiaTurkeyTurkmenistanUkraineUnited Arab EmiratesUnited KingdomUnited StatesUpper middle incomeUruguayUzbekistanVenezuela, RBVietnamWorldYemen, Rep.ZambiaZimbabwe Timeline:
This timeline shows a graph from 1961 to 2015 of Greece. No data until 1960. Number of actual observations by date: 55.
Source name:
World Development Indicators
Source organization:
IEA Statistics © OECD/IEA 2014 (http://www.iea.org/stats/index.asp), subject to https://www.iea.org/t&c/termsandconditions/
Categories, topics:
Energy & Mining, Climate Change, Infrastructure
Last updated:
apr 23, 2017
Indicators value changes by year
Maximum:
28.757
jan 1, 1967
At the date of observation
Value
Absolute change
Change from previous value
jan 1, 1961
20.306
+20.306
0.0%
jan 1, 1962
21.883
+1.578
7.77%
jan 1, 1963
21.95
+0.067
0.31%
jan 1, 1964
25.428
+3.477
15.84%
jan 1, 1965
19.824
-5.603
-22.04%
jan 1, 1966
17.326
-2.498
-12.6%
jan 1, 1967
28.757
+11.43
65.97%
jan 1, 1968
23.83
-4.927
-17.13%
jan 1, 1969
17.769
-6.061
-25.44%
jan 1, 1970
23.294
+5.525
31.1%
jan 1, 1971
26.843
+3.549
15.24%
jan 1, 1972
22.937
-3.906
-14.55%
jan 1, 1973
20.402
-2.535
-11.05%
jan 1, 1974
15.003
-5.399
-26.46%
jan 1, 1975
15.626
+0.623
4.15%
jan 1, 1976
12.5
-3.126
-20.0%
jan 1, 1977
10.531
-1.969
-15.75%
jan 1, 1978
10.124
-0.407
-3.86%
jan 1, 1979
14.195
+4.071
40.21%
jan 1, 1980
16.134
+1.94
13.66%
jan 1, 1981
15.031
-1.103
-6.84%
jan 1, 1982
14.564
-0.467
-3.11%
jan 1, 1983
15.302
+0.737
5.06%
jan 1, 1984
9.757
-5.545
-36.24%
jan 1, 1985
11.538
+1.782
18.26%
jan 1, 1986
10.112
-1.427
-12.36%
jan 1, 1987
11.503
+1.391
13.76%
jan 1, 1988
9.24
-2.262
-19.67%
jan 1, 1989
7.135
-2.106
-22.79%
jan 1, 1990
5.554
-1.581
-22.16%
jan 1, 1991
5.087
-0.467
-8.41%
jan 1, 1992
8.67
+3.583
70.44%
jan 1, 1993
5.918
-2.752
-31.74%
jan 1, 1994
5.984
+0.066
1.11%
jan 1, 1995
6.436
+0.453
7.56%
jan 1, 1996
8.545
+2.109
32.76%
jan 1, 1997
10.252
+1.707
19.98%
jan 1, 1998
8.967
-1.285
-12.53%
jan 1, 1999
8.049
-0.918
-10.24%
jan 1, 2000
9.296
+1.248
15.5%
jan 1, 2001
6.912
-2.384
-25.64%
jan 1, 2002
3.951
-2.962
-42.84%
jan 1, 2003
5.19
+1.24
31.37%
jan 1, 2004
8.231
+3.04
58.57%
jan 1, 2005
7.944
-0.287
-3.49%
jan 1, 2006
8.442
+0.498
6.27%
jan 1, 2007
9.746
+1.304
15.44%
jan 1, 2008
4.132
-5.614
-57.61%
jan 1, 2009
5.264
+1.133
27.42%
jan 1, 2010
8.796
+3.532
67.09%
jan 1, 2011
13.004
+4.208
47.84%
jan 1, 2012
6.779
-6.225
-47.87%
jan 1, 2013
7.245
+0.467
6.88%
jan 1, 2014
11.111
+3.866
53.36%
jan 1, 2015
9.378
-1.733
-15.6%
Ranking of countries by current statistics by years


Comments: