29
/
en
AIzaSyAYiBZKx7MnpbEhh9jyipgxe19OcubqV5w
April 1, 2024
123371
Ecuador
ECU
true
2
1
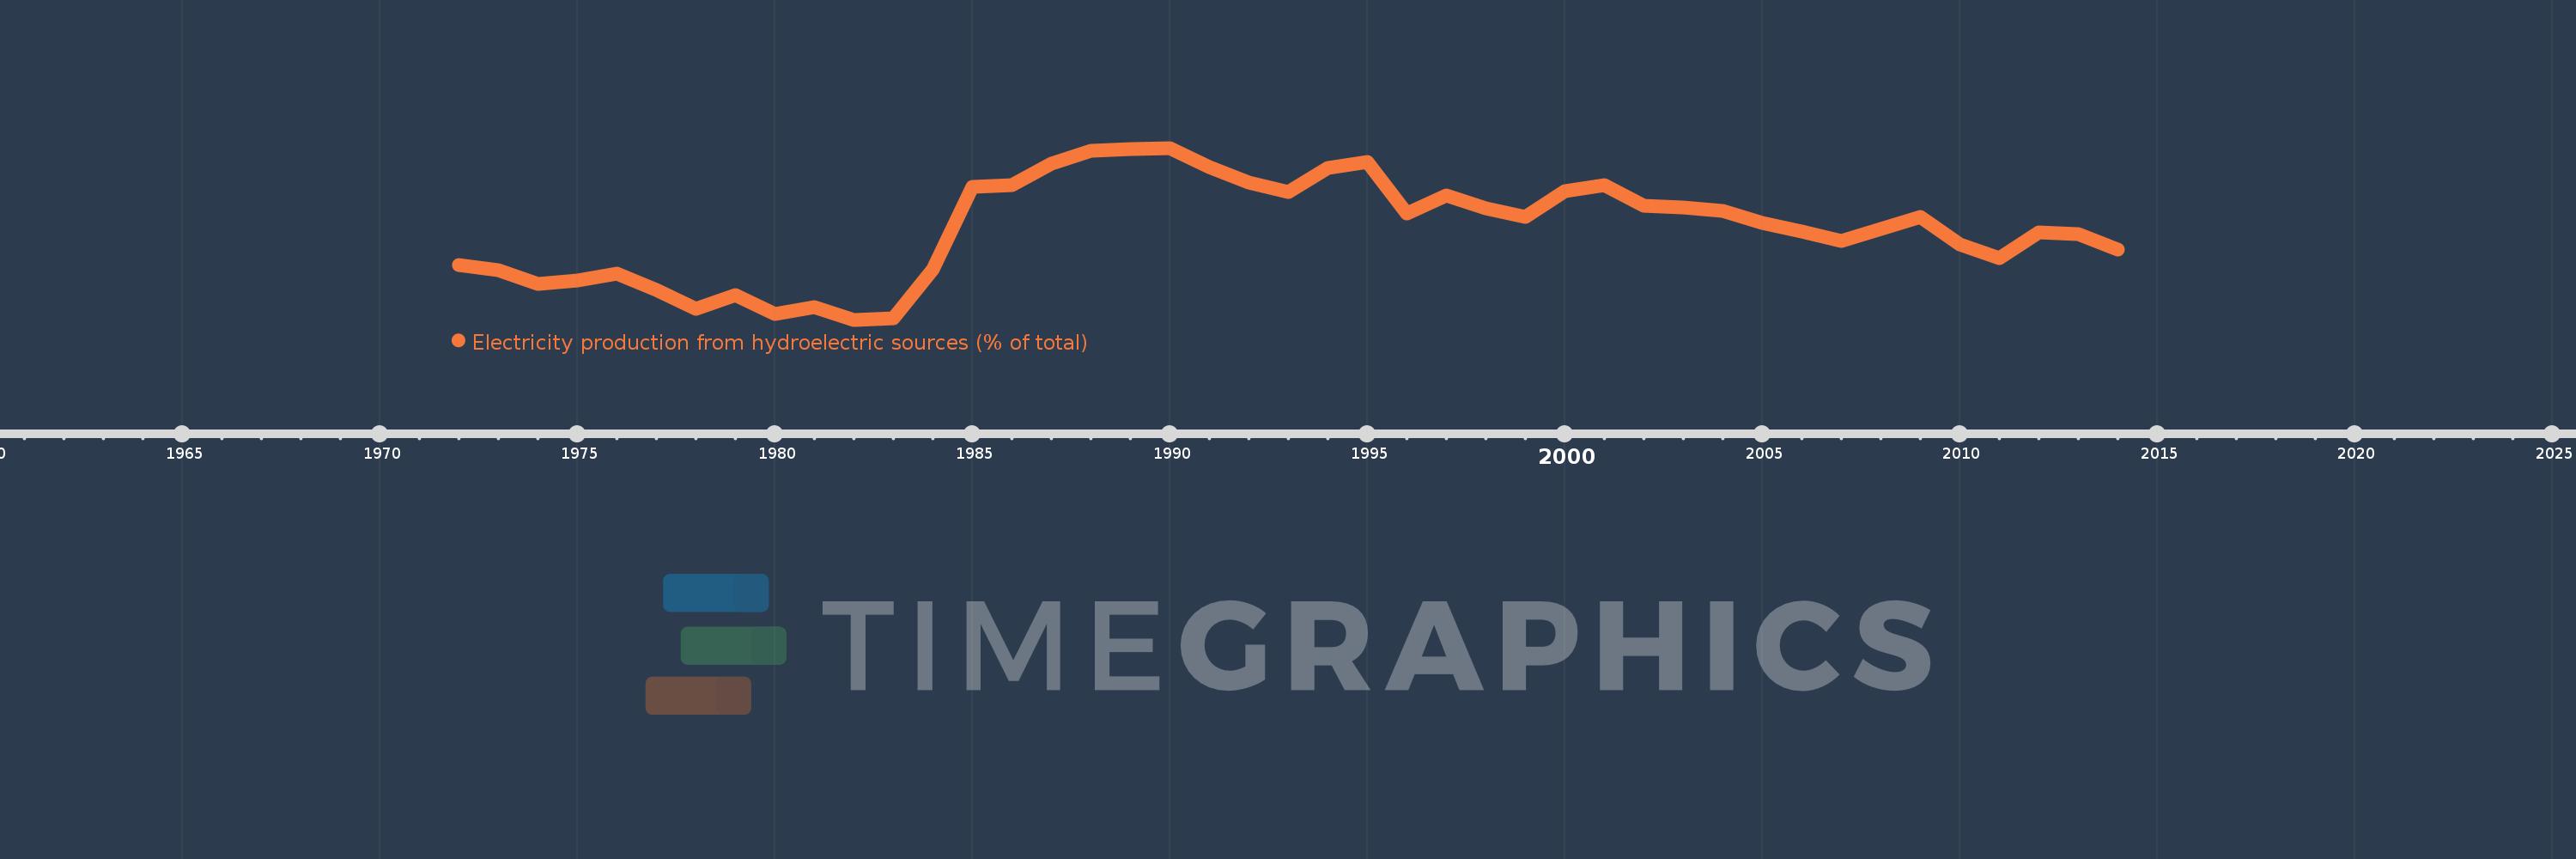
Electricity production from hydroelectric sources (% of total)
2014,2013,2012,2011,2010,2009,2008,2007,2006,2005,2004,2003,2002,2001,2000,1999,1998,1997,1996,1995,1994,1993,1992,1991,1990,1989,1988,1987,1986,1985,1984,1983,1982,1981,1980,1979,1978,1977,1976,1975,1974,1973,1972
This statistics in other country:
AlbaniaAlgeriaAngolaArab WorldArgentinaArmeniaAustraliaAustriaAzerbaijanBahrainBangladeshBelarusBelgiumBeninBoliviaBosnia and HerzegovinaBotswanaBrazilBrunei DarussalamBulgariaCambodiaCameroonCanadaCentral Europe and the BalticsChileChinaColombiaCongo, Dem. Rep.Congo, Rep.Costa RicaCote d'IvoireCroatiaCubaCuracaoCyprusCzech RepublicDenmarkDominican RepublicEarly-demographic dividendEast Asia & PacificEast Asia & Pacific (excluding high income)East Asia & Pacific (IDA & IBRD countries)EcuadorEgypt, Arab Rep.El SalvadorEritreaEstoniaEthiopiaEuro areaEurope & Central AsiaEurope & Central Asia (excluding high income)Europe & Central Asia (IDA & IBRD countries)European UnionFinlandFragile and conflict affected situationsFranceGabonGeorgiaGermanyGhanaGibraltarGreeceGuatemalaHaitiHeavily indebted poor countries (HIPC)High incomeHondurasHong Kong SAR, ChinaHungaryIBRD onlyIcelandIDA & IBRD totalIDA blendIDA onlyIDA totalIndiaIndonesiaIran, Islamic Rep.IraqIrelandIsraelItalyJamaicaJapanJordanKazakhstanKenyaKorea, Dem. People’s Rep.Korea, Rep.KosovoKuwaitKyrgyz RepublicLate-demographic dividendLatin America & Caribbean Latin America & Caribbean (excluding high income)Latin America & the Caribbean (IDA & IBRD countries)LatviaLeast developed countries: UN classificationLebanonLibyaLithuaniaLow & middle incomeLower middle incomeLuxembourgMacedonia, FYRMalaysiaMaltaMauritiusMexicoMiddle East & North AfricaMiddle East & North Africa (excluding high income)Middle East & North Africa (IDA & IBRD countries)Middle incomeMoldovaMongoliaMontenegroMoroccoMozambiqueMyanmarNamibiaNepalNetherlandsNew ZealandNicaraguaNigerNigeriaNorth AmericaNorwayOECD membersOmanOther small statesPakistanPanamaParaguayPeruPhilippinesPolandPortugalPost-demographic dividendPre-demographic dividendQatarRomaniaRussian FederationSaudi ArabiaSenegalSerbiaSingaporeSlovak RepublicSloveniaSmall statesSouth AfricaSouth AsiaSouth Asia (IDA & IBRD)South SudanSpainSri LankaSub-Saharan Africa Sub-Saharan Africa (excluding high income)Sub-Saharan Africa (IDA & IBRD countries)SudanSwedenSwitzerlandSyrian Arab RepublicTajikistanTanzaniaThailandTogoTrinidad and TobagoTunisiaTurkeyTurkmenistanUkraineUnited Arab EmiratesUnited KingdomUnited StatesUpper middle incomeUruguayUzbekistanVenezuela, RBVietnamWorldYemen, Rep.ZambiaZimbabwe Timeline:
This timeline shows a graph from 1972 to 2014 of Ecuador. No data until 1971. Number of actual observations by date: 43.
Source name:
World Development Indicators
Source organization:
IEA Statistics © OECD/IEA 2014 (http://www.iea.org/stats/index.asp), subject to https://www.iea.org/t&c/termsandconditions/
Categories, topics:
Energy & Mining, Climate Change, Infrastructure
Last updated:
apr 23, 2017
Indicators value changes by year
Minimum:
21.134
jan 1, 1982
Maximum:
85.873
jan 1, 1990
At the date of observation
Value
Absolute change
Change from previous value
jan 1, 1972
41.905
+41.905
0.0%
jan 1, 1973
39.839
-2.066
-4.93%
jan 1, 1974
34.634
-5.205
-13.07%
jan 1, 1975
35.842
+1.209
3.49%
jan 1, 1976
38.575
+2.733
7.62%
jan 1, 1977
32.509
-6.066
-15.72%
jan 1, 1978
25.398
-7.111
-21.87%
jan 1, 1979
30.365
+4.966
19.55%
jan 1, 1980
23.185
-7.18
-23.64%
jan 1, 1981
25.86
+2.675
11.54%
jan 1, 1982
21.134
-4.726
-18.28%
jan 1, 1983
21.624
+0.49
2.32%
jan 1, 1984
39.995
+18.372
84.96%
jan 1, 1985
71.274
+31.279
78.21%
jan 1, 1986
71.939
+0.665
0.93%
jan 1, 1987
80.048
+8.108
11.27%
jan 1, 1988
84.881
+4.833
6.04%
jan 1, 1989
85.552
+0.671
0.79%
jan 1, 1990
85.873
+0.321
0.37%
jan 1, 1991
78.548
-7.325
-8.53%
jan 1, 1992
72.77
-5.778
-7.36%
jan 1, 1993
69.122
-3.649
-5.01%
jan 1, 1994
78.397
+9.275
13.42%
jan 1, 1995
80.611
+2.215
2.82%
jan 1, 1996
61.229
-19.382
-24.04%
jan 1, 1997
67.923
+6.694
10.93%
jan 1, 1998
63.057
-4.866
-7.16%
jan 1, 1999
59.743
-3.314
-5.26%
jan 1, 2000
69.626
+9.883
16.54%
jan 1, 2001
71.702
+2.076
2.98%
jan 1, 2002
63.991
-7.711
-10.75%
jan 1, 2003
63.299
-0.692
-1.08%
jan 1, 2004
62.195
-1.104
-1.74%
jan 1, 2005
57.573
-4.621
-7.43%
jan 1, 2006
54.304
-3.27
-5.68%
jan 1, 2007
50.657
-3.647
-6.72%
jan 1, 2008
55.198
+4.541
8.96%
jan 1, 2009
60.02
+4.822
8.74%
jan 1, 2010
49.663
-10.357
-17.26%
jan 1, 2011
44.267
-5.397
-10.87%
jan 1, 2012
54.191
+9.924
22.42%
jan 1, 2013
53.565
-0.626
-1.16%
jan 1, 2014
47.461
-6.104
-11.4%
Ranking of countries by current statistics by years


Comments: