29
/
en
AIzaSyAYiBZKx7MnpbEhh9jyipgxe19OcubqV5w
April 1, 2024
73805
Austria
AUT
true
2
1
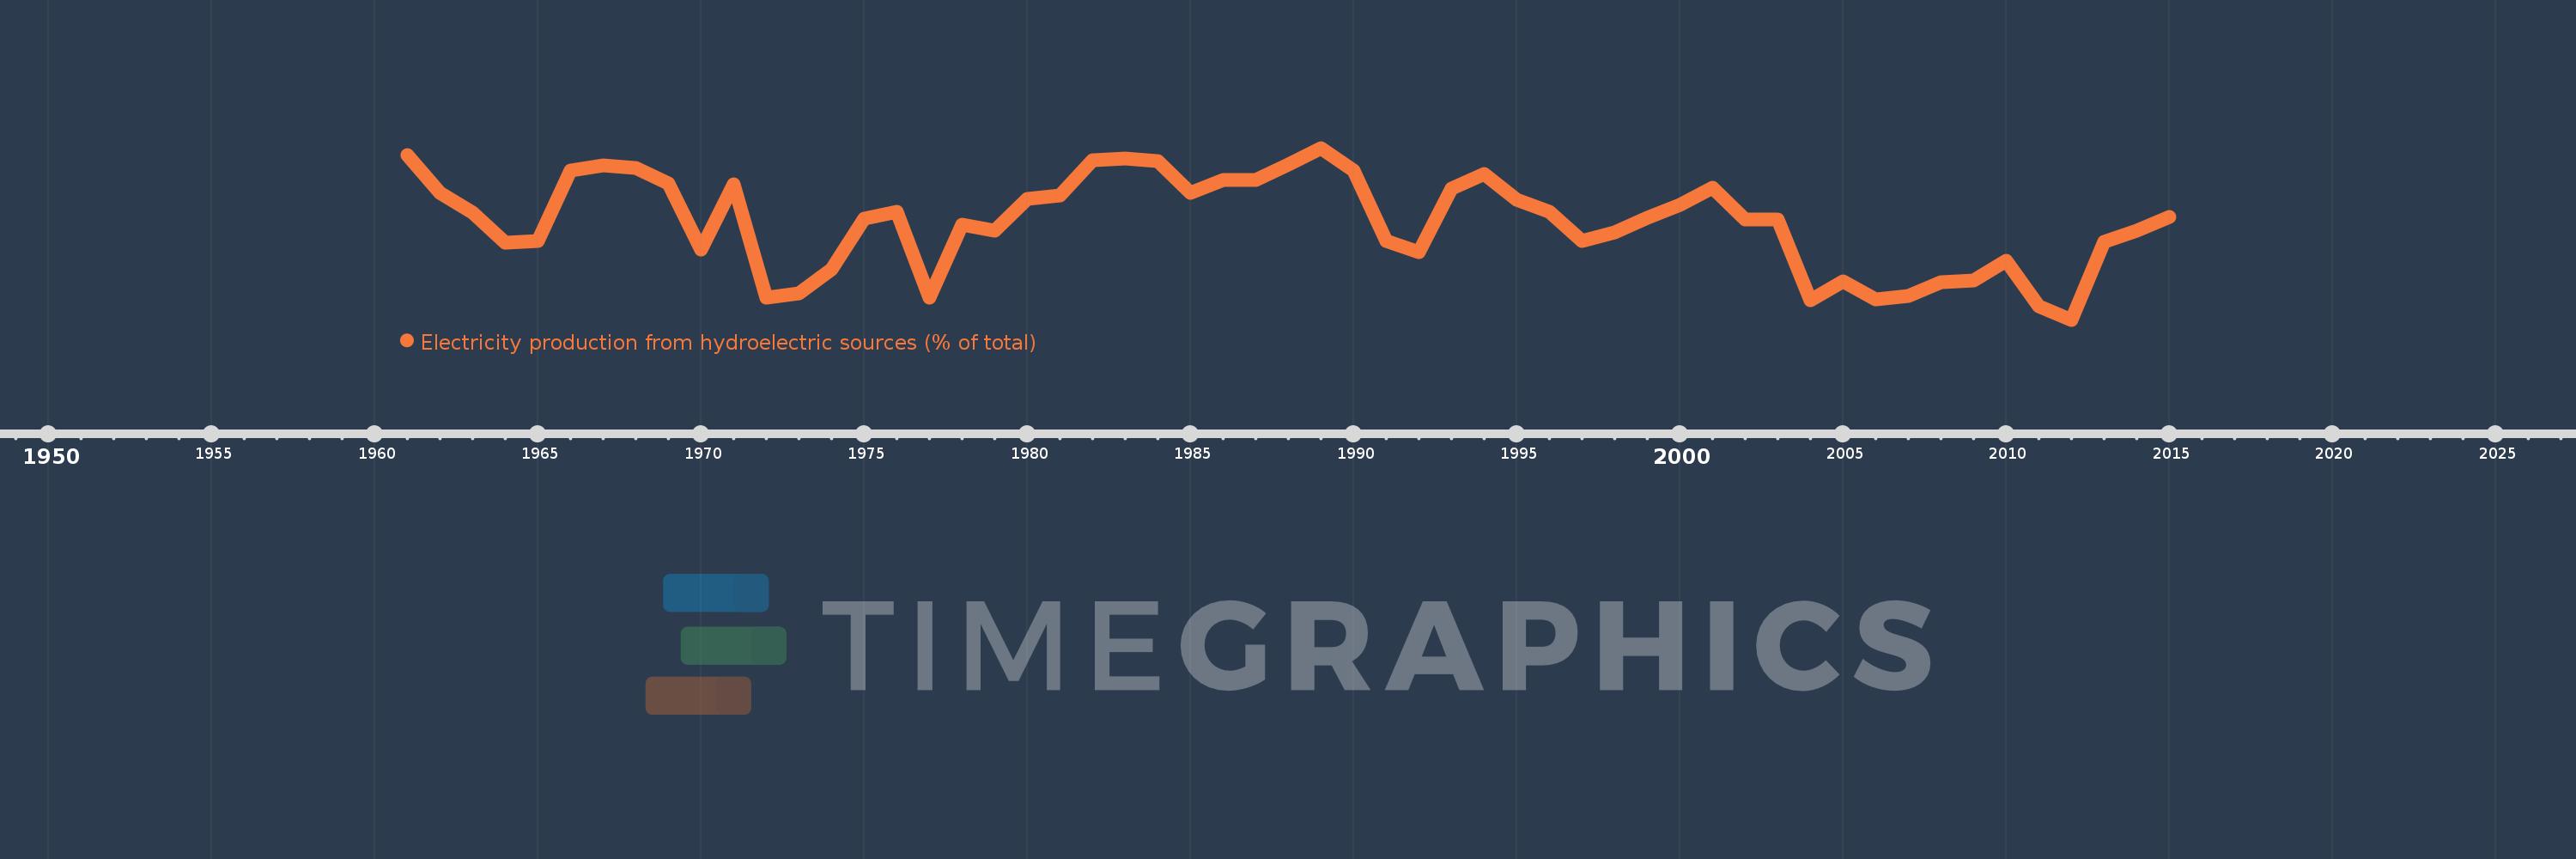
Electricity production from hydroelectric sources (% of total)
2015,2014,2013,2012,2011,2010,2009,2008,2007,2006,2005,2004,2003,2002,2001,2000,1999,1998,1997,1996,1995,1994,1993,1992,1991,1990,1989,1988,1987,1986,1985,1984,1983,1982,1981,1980,1979,1978,1977,1976,1975,1974,1973,1972,1971,1970,1969,1968,1967,1966,1965,1964,1963,1962,1961
This statistics in other country:
AlbaniaAlgeriaAngolaArab WorldArgentinaArmeniaAustraliaAustriaAzerbaijanBahrainBangladeshBelarusBelgiumBeninBoliviaBosnia and HerzegovinaBotswanaBrazilBrunei DarussalamBulgariaCambodiaCameroonCanadaCentral Europe and the BalticsChileChinaColombiaCongo, Dem. Rep.Congo, Rep.Costa RicaCote d'IvoireCroatiaCubaCuracaoCyprusCzech RepublicDenmarkDominican RepublicEarly-demographic dividendEast Asia & PacificEast Asia & Pacific (excluding high income)East Asia & Pacific (IDA & IBRD countries)EcuadorEgypt, Arab Rep.El SalvadorEritreaEstoniaEthiopiaEuro areaEurope & Central AsiaEurope & Central Asia (excluding high income)Europe & Central Asia (IDA & IBRD countries)European UnionFinlandFragile and conflict affected situationsFranceGabonGeorgiaGermanyGhanaGibraltarGreeceGuatemalaHaitiHeavily indebted poor countries (HIPC)High incomeHondurasHong Kong SAR, ChinaHungaryIBRD onlyIcelandIDA & IBRD totalIDA blendIDA onlyIDA totalIndiaIndonesiaIran, Islamic Rep.IraqIrelandIsraelItalyJamaicaJapanJordanKazakhstanKenyaKorea, Dem. People’s Rep.Korea, Rep.KosovoKuwaitKyrgyz RepublicLate-demographic dividendLatin America & Caribbean Latin America & Caribbean (excluding high income)Latin America & the Caribbean (IDA & IBRD countries)LatviaLeast developed countries: UN classificationLebanonLibyaLithuaniaLow & middle incomeLower middle incomeLuxembourgMacedonia, FYRMalaysiaMaltaMauritiusMexicoMiddle East & North AfricaMiddle East & North Africa (excluding high income)Middle East & North Africa (IDA & IBRD countries)Middle incomeMoldovaMongoliaMontenegroMoroccoMozambiqueMyanmarNamibiaNepalNetherlandsNew ZealandNicaraguaNigerNigeriaNorth AmericaNorwayOECD membersOmanOther small statesPakistanPanamaParaguayPeruPhilippinesPolandPortugalPost-demographic dividendPre-demographic dividendQatarRomaniaRussian FederationSaudi ArabiaSenegalSerbiaSingaporeSlovak RepublicSloveniaSmall statesSouth AfricaSouth AsiaSouth Asia (IDA & IBRD)South SudanSpainSri LankaSub-Saharan Africa Sub-Saharan Africa (excluding high income)Sub-Saharan Africa (IDA & IBRD countries)SudanSwedenSwitzerlandSyrian Arab RepublicTajikistanTanzaniaThailandTogoTrinidad and TobagoTunisiaTurkeyTurkmenistanUkraineUnited Arab EmiratesUnited KingdomUnited StatesUpper middle incomeUruguayUzbekistanVenezuela, RBVietnamWorldYemen, Rep.ZambiaZimbabwe Timeline:
This timeline shows a graph from 1961 to 2015 of Austria. No data until 1960. Number of actual observations by date: 55.
Source name:
World Development Indicators
Source organization:
IEA Statistics © OECD/IEA 2014 (http://www.iea.org/stats/index.asp), subject to https://www.iea.org/t&c/termsandconditions/
Categories, topics:
Energy & Mining, Climate Change, Infrastructure
Last updated:
apr 23, 2017
Indicators value changes by year
Minimum:
54.988
jan 1, 2012
Maximum:
74.365
jan 1, 1989
At the date of observation
Value
Absolute change
Change from previous value
jan 1, 1961
73.559
+73.559
0.0%
jan 1, 1962
69.294
-4.266
-5.8%
jan 1, 1963
67.099
-2.194
-3.17%
jan 1, 1964
63.672
-3.428
-5.11%
jan 1, 1965
63.892
+0.221
0.35%
jan 1, 1966
71.82
+7.927
12.41%
jan 1, 1967
72.432
+0.612
0.85%
jan 1, 1968
72.066
-0.366
-0.51%
jan 1, 1969
70.317
-1.748
-2.43%
jan 1, 1970
62.874
-7.444
-10.59%
jan 1, 1971
70.219
+7.346
11.68%
jan 1, 1972
57.503
-12.716
-18.11%
jan 1, 1973
57.995
+0.492
0.86%
jan 1, 1974
60.648
+2.653
4.58%
jan 1, 1975
66.418
+5.77
9.51%
jan 1, 1976
67.194
+0.776
1.17%
jan 1, 1977
57.47
-9.725
-14.47%
jan 1, 1978
65.675
+8.205
14.28%
jan 1, 1979
65.026
-0.648
-0.99%
jan 1, 1980
68.659
+3.633
5.59%
jan 1, 1981
69.05
+0.391
0.57%
jan 1, 1982
73.018
+3.967
5.75%
jan 1, 1983
73.153
+0.135
0.18%
jan 1, 1984
72.92
-0.233
-0.32%
jan 1, 1985
69.292
-3.628
-4.98%
jan 1, 1986
70.731
+1.439
2.08%
jan 1, 1987
70.757
+0.027
0.04%
jan 1, 1988
72.514
+1.757
2.48%
jan 1, 1989
74.365
+1.851
2.55%
jan 1, 1990
71.787
-2.578
-3.47%
jan 1, 1991
63.918
-7.869
-10.96%
jan 1, 1992
62.659
-1.259
-1.97%
jan 1, 1993
69.781
+7.122
11.37%
jan 1, 1994
71.453
+1.672
2.4%
jan 1, 1995
68.523
-2.93
-4.1%
jan 1, 1996
67.177
-1.346
-1.96%
jan 1, 1997
63.867
-3.31
-4.93%
jan 1, 1998
64.838
+0.971
1.52%
jan 1, 1999
66.469
+1.631
2.52%
jan 1, 2000
67.927
+1.457
2.19%
jan 1, 2001
69.873
+1.947
2.87%
jan 1, 2002
66.247
-3.626
-5.19%
jan 1, 2003
66.265
+0.018
0.03%
jan 1, 2004
57.172
-9.094
-13.72%
jan 1, 2005
59.344
+2.173
3.8%
jan 1, 2006
57.249
-2.096
-3.53%
jan 1, 2007
57.711
+0.462
0.81%
jan 1, 2008
59.259
+1.548
2.68%
jan 1, 2009
59.425
+0.167
0.28%
jan 1, 2010
61.669
+2.244
3.78%
jan 1, 2011
56.472
-5.197
-8.43%
jan 1, 2012
54.988
-1.484
-2.63%
jan 1, 2013
63.752
+8.764
15.94%
jan 1, 2014
65.041
+1.29
2.02%
jan 1, 2015
66.61
+1.569
2.41%
Ranking of countries by current statistics by years


Comments: