29
/
en
AIzaSyAYiBZKx7MnpbEhh9jyipgxe19OcubqV5w
April 1, 2024
224734
Poland
POL
true
2
1
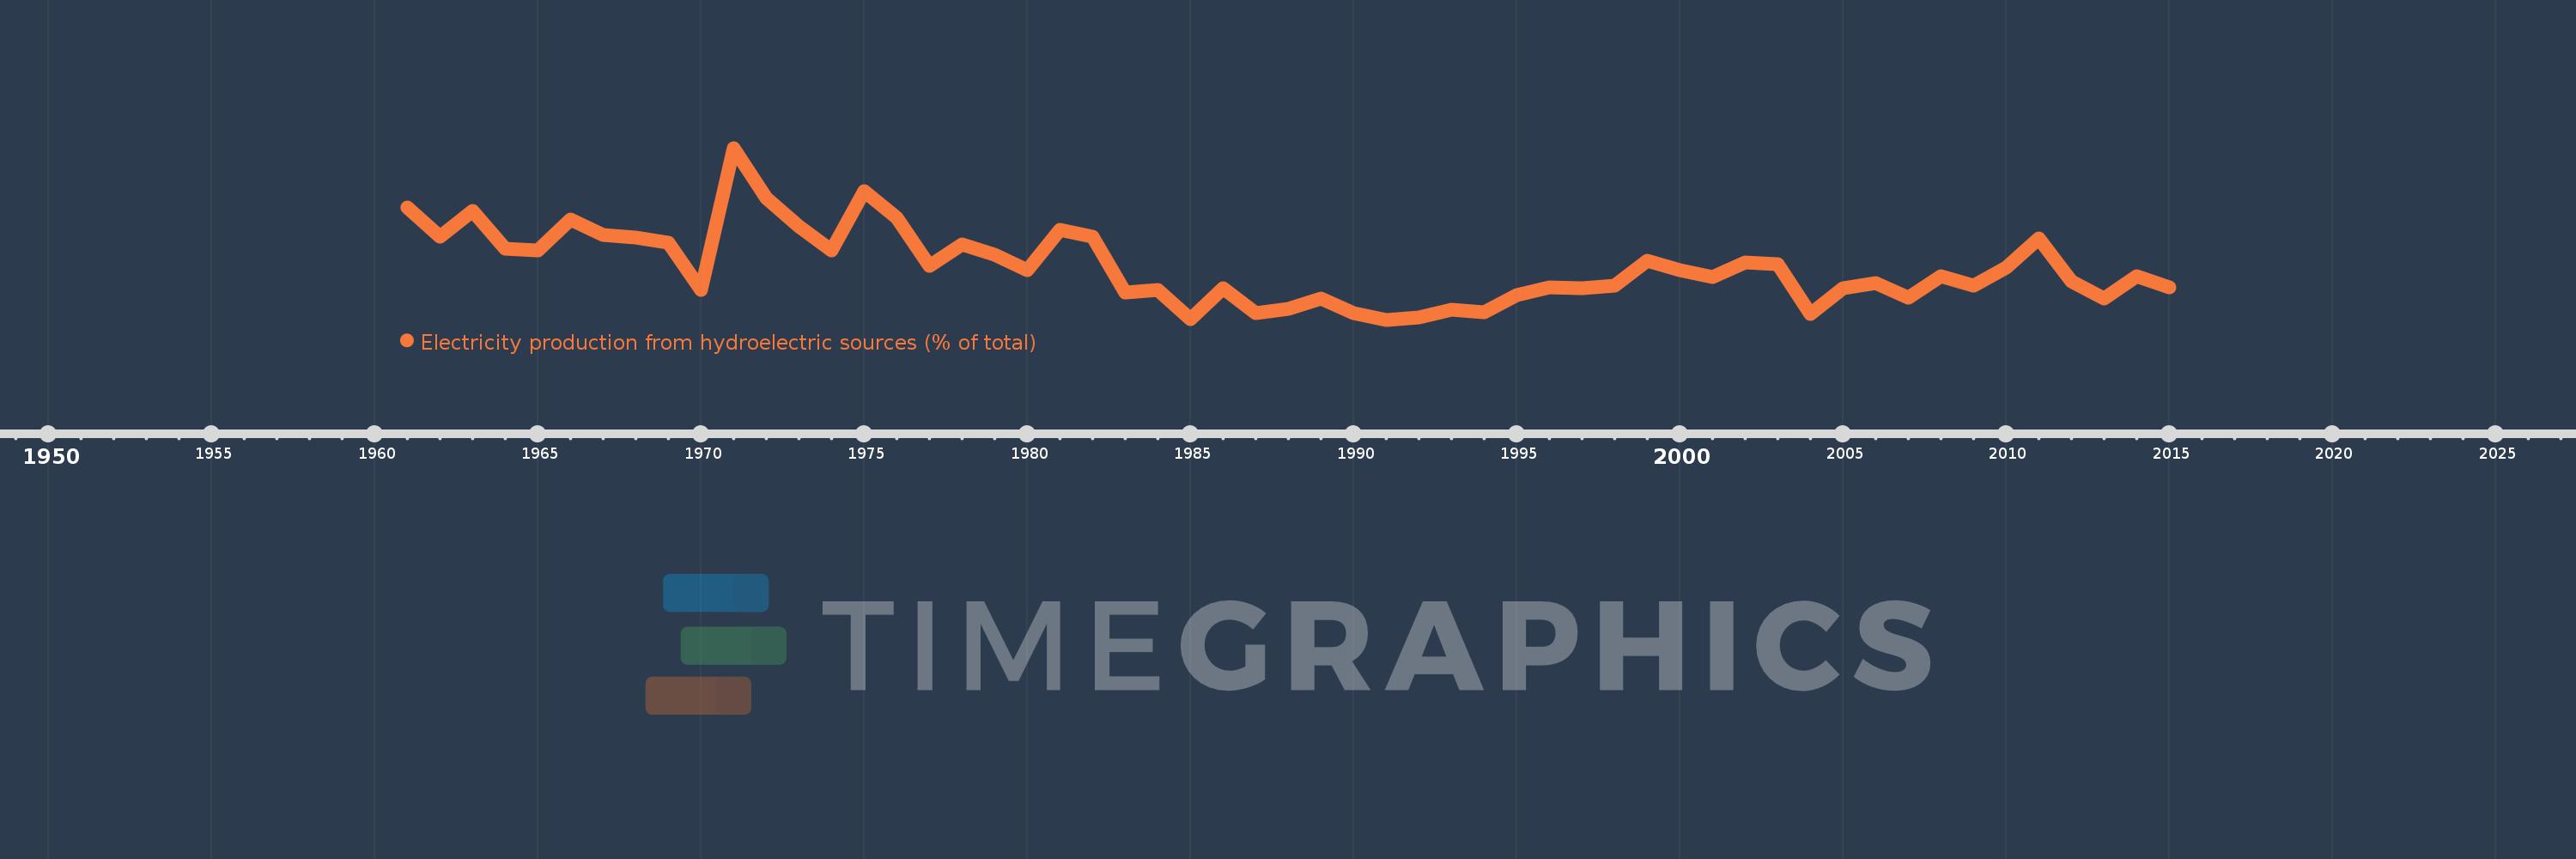
Electricity production from hydroelectric sources (% of total)
2015,2014,2013,2012,2011,2010,2009,2008,2007,2006,2005,2004,2003,2002,2001,2000,1999,1998,1997,1996,1995,1994,1993,1992,1991,1990,1989,1988,1987,1986,1985,1984,1983,1982,1981,1980,1979,1978,1977,1976,1975,1974,1973,1972,1971,1970,1969,1968,1967,1966,1965,1964,1963,1962,1961
This statistics in other country:
AlbaniaAlgeriaAngolaArab WorldArgentinaArmeniaAustraliaAustriaAzerbaijanBahrainBangladeshBelarusBelgiumBeninBoliviaBosnia and HerzegovinaBotswanaBrazilBrunei DarussalamBulgariaCambodiaCameroonCanadaCentral Europe and the BalticsChileChinaColombiaCongo, Dem. Rep.Congo, Rep.Costa RicaCote d'IvoireCroatiaCubaCuracaoCyprusCzech RepublicDenmarkDominican RepublicEarly-demographic dividendEast Asia & PacificEast Asia & Pacific (excluding high income)East Asia & Pacific (IDA & IBRD countries)EcuadorEgypt, Arab Rep.El SalvadorEritreaEstoniaEthiopiaEuro areaEurope & Central AsiaEurope & Central Asia (excluding high income)Europe & Central Asia (IDA & IBRD countries)European UnionFinlandFragile and conflict affected situationsFranceGabonGeorgiaGermanyGhanaGibraltarGreeceGuatemalaHaitiHeavily indebted poor countries (HIPC)High incomeHondurasHong Kong SAR, ChinaHungaryIBRD onlyIcelandIDA & IBRD totalIDA blendIDA onlyIDA totalIndiaIndonesiaIran, Islamic Rep.IraqIrelandIsraelItalyJamaicaJapanJordanKazakhstanKenyaKorea, Dem. People’s Rep.Korea, Rep.KosovoKuwaitKyrgyz RepublicLate-demographic dividendLatin America & Caribbean Latin America & Caribbean (excluding high income)Latin America & the Caribbean (IDA & IBRD countries)LatviaLeast developed countries: UN classificationLebanonLibyaLithuaniaLow & middle incomeLower middle incomeLuxembourgMacedonia, FYRMalaysiaMaltaMauritiusMexicoMiddle East & North AfricaMiddle East & North Africa (excluding high income)Middle East & North Africa (IDA & IBRD countries)Middle incomeMoldovaMongoliaMontenegroMoroccoMozambiqueMyanmarNamibiaNepalNetherlandsNew ZealandNicaraguaNigerNigeriaNorth AmericaNorwayOECD membersOmanOther small statesPakistanPanamaParaguayPeruPhilippinesPolandPortugalPost-demographic dividendPre-demographic dividendQatarRomaniaRussian FederationSaudi ArabiaSenegalSerbiaSingaporeSlovak RepublicSloveniaSmall statesSouth AfricaSouth AsiaSouth Asia (IDA & IBRD)South SudanSpainSri LankaSub-Saharan Africa Sub-Saharan Africa (excluding high income)Sub-Saharan Africa (IDA & IBRD countries)SudanSwedenSwitzerlandSyrian Arab RepublicTajikistanTanzaniaThailandTogoTrinidad and TobagoTunisiaTurkeyTurkmenistanUkraineUnited Arab EmiratesUnited KingdomUnited StatesUpper middle incomeUruguayUzbekistanVenezuela, RBVietnamWorldYemen, Rep.ZambiaZimbabwe Timeline:
This timeline shows a graph from 1961 to 2015 of Poland. No data until 1960. Number of actual observations by date: 55.
Source name:
World Development Indicators
Source organization:
IEA Statistics © OECD/IEA 2014 (http://www.iea.org/stats/index.asp), subject to https://www.iea.org/t&c/termsandconditions/
Categories, topics:
Energy & Mining, Climate Change, Infrastructure
Last updated:
apr 23, 2017
Indicators value changes by year
At the date of observation
Value
Absolute change
Change from previous value
jan 1, 1961
2.158
+2.158
0.0%
jan 1, 1962
1.873
-0.285
-13.2%
jan 1, 1963
2.132
+0.259
13.81%
jan 1, 1964
1.751
-0.381
-17.85%
jan 1, 1965
1.737
-0.015
-0.83%
jan 1, 1966
2.046
+0.309
17.82%
jan 1, 1967
1.892
-0.154
-7.54%
jan 1, 1968
1.868
-0.024
-1.25%
jan 1, 1969
1.812
-0.057
-3.03%
jan 1, 1970
1.351
-0.461
-25.43%
jan 1, 1971
2.749
+1.398
103.5%
jan 1, 1972
2.256
-0.493
-17.93%
jan 1, 1973
1.976
-0.28
-12.4%
jan 1, 1974
1.735
-0.241
-12.21%
jan 1, 1975
2.325
+0.59
33.98%
jan 1, 1976
2.056
-0.269
-11.56%
jan 1, 1977
1.587
-0.469
-22.81%
jan 1, 1978
1.797
+0.21
13.2%
jan 1, 1979
1.695
-0.102
-5.67%
jan 1, 1980
1.547
-0.148
-8.73%
jan 1, 1981
1.942
+0.395
25.56%
jan 1, 1982
1.872
-0.07
-3.6%
jan 1, 1983
1.324
-0.548
-29.29%
jan 1, 1984
1.349
+0.025
1.86%
jan 1, 1985
1.06
-0.289
-21.41%
jan 1, 1986
1.365
+0.305
28.81%
jan 1, 1987
1.122
-0.243
-17.81%
jan 1, 1988
1.158
+0.036
3.21%
jan 1, 1989
1.263
+0.105
9.07%
jan 1, 1990
1.123
-0.14
-11.11%
jan 1, 1991
1.054
-0.068
-6.1%
jan 1, 1992
1.074
+0.019
1.84%
jan 1, 1993
1.153
+0.08
7.41%
jan 1, 1994
1.129
-0.024
-2.08%
jan 1, 1995
1.3
+0.171
15.14%
jan 1, 1996
1.377
+0.077
5.91%
jan 1, 1997
1.368
-0.009
-0.68%
jan 1, 1998
1.391
+0.024
1.74%
jan 1, 1999
1.64
+0.249
17.88%
jan 1, 2000
1.539
-0.101
-6.16%
jan 1, 2001
1.471
-0.068
-4.44%
jan 1, 2002
1.618
+0.147
9.98%
jan 1, 2003
1.599
-0.018
-1.14%
jan 1, 2004
1.114
-0.485
-30.35%
jan 1, 2005
1.365
+0.251
22.52%
jan 1, 2006
1.417
+0.052
3.8%
jan 1, 2007
1.27
-0.147
-10.34%
jan 1, 2008
1.481
+0.211
16.63%
jan 1, 2009
1.391
-0.09
-6.11%
jan 1, 2010
1.572
+0.181
12.98%
jan 1, 2011
1.859
+0.287
18.28%
jan 1, 2012
1.429
-0.43
-23.12%
jan 1, 2013
1.26
-0.169
-11.85%
jan 1, 2014
1.487
+0.228
18.06%
jan 1, 2015
1.371
-0.116
-7.83%
Ranking of countries by current statistics by years


Comments: