29
/
en
AIzaSyAYiBZKx7MnpbEhh9jyipgxe19OcubqV5w
April 1, 2024
256223
Sweden
SWE
true
2
1
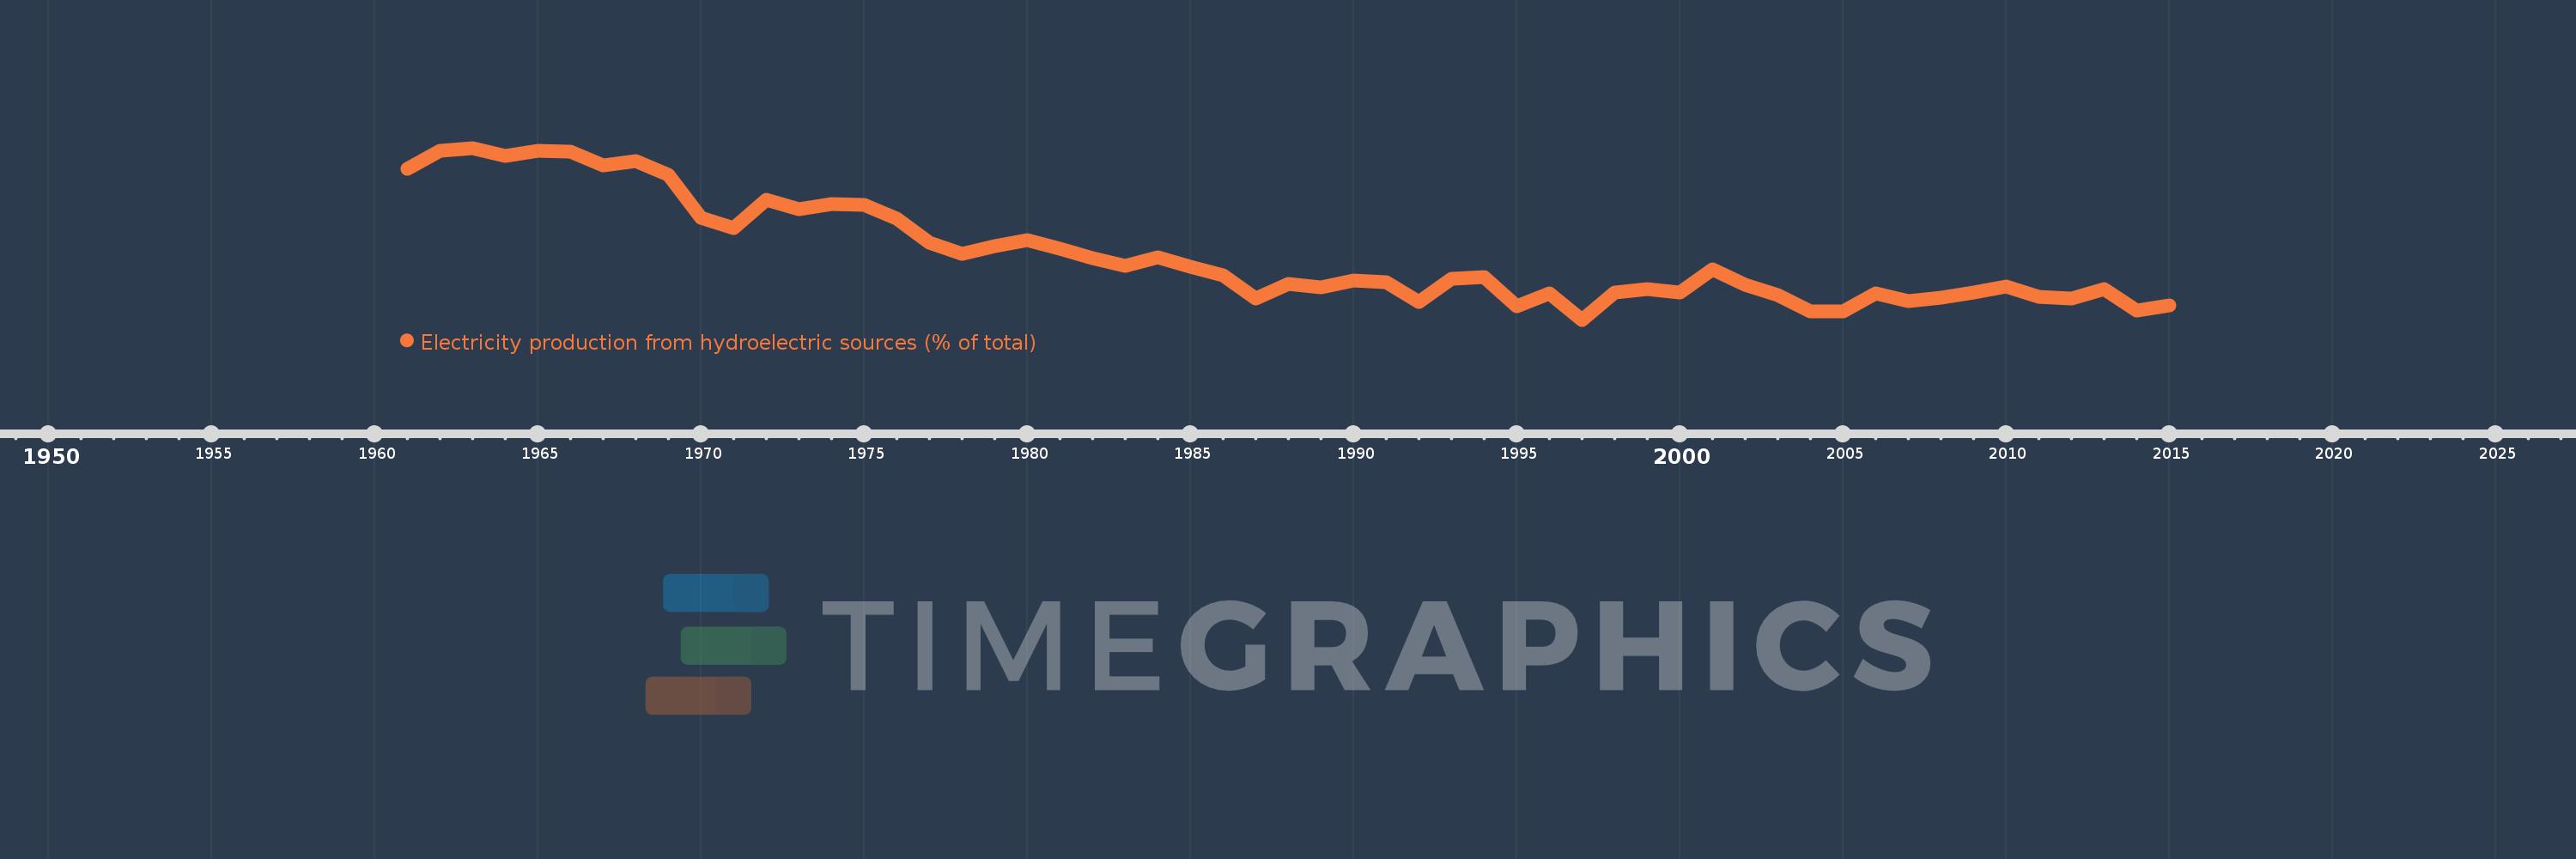
Electricity production from hydroelectric sources (% of total)
2015,2014,2013,2012,2011,2010,2009,2008,2007,2006,2005,2004,2003,2002,2001,2000,1999,1998,1997,1996,1995,1994,1993,1992,1991,1990,1989,1988,1987,1986,1985,1984,1983,1982,1981,1980,1979,1978,1977,1976,1975,1974,1973,1972,1971,1970,1969,1968,1967,1966,1965,1964,1963,1962,1961
This statistics in other country:
AlbaniaAlgeriaAngolaArab WorldArgentinaArmeniaAustraliaAustriaAzerbaijanBahrainBangladeshBelarusBelgiumBeninBoliviaBosnia and HerzegovinaBotswanaBrazilBrunei DarussalamBulgariaCambodiaCameroonCanadaCentral Europe and the BalticsChileChinaColombiaCongo, Dem. Rep.Congo, Rep.Costa RicaCote d'IvoireCroatiaCubaCuracaoCyprusCzech RepublicDenmarkDominican RepublicEarly-demographic dividendEast Asia & PacificEast Asia & Pacific (excluding high income)East Asia & Pacific (IDA & IBRD countries)EcuadorEgypt, Arab Rep.El SalvadorEritreaEstoniaEthiopiaEuro areaEurope & Central AsiaEurope & Central Asia (excluding high income)Europe & Central Asia (IDA & IBRD countries)European UnionFinlandFragile and conflict affected situationsFranceGabonGeorgiaGermanyGhanaGibraltarGreeceGuatemalaHaitiHeavily indebted poor countries (HIPC)High incomeHondurasHong Kong SAR, ChinaHungaryIBRD onlyIcelandIDA & IBRD totalIDA blendIDA onlyIDA totalIndiaIndonesiaIran, Islamic Rep.IraqIrelandIsraelItalyJamaicaJapanJordanKazakhstanKenyaKorea, Dem. People’s Rep.Korea, Rep.KosovoKuwaitKyrgyz RepublicLate-demographic dividendLatin America & Caribbean Latin America & Caribbean (excluding high income)Latin America & the Caribbean (IDA & IBRD countries)LatviaLeast developed countries: UN classificationLebanonLibyaLithuaniaLow & middle incomeLower middle incomeLuxembourgMacedonia, FYRMalaysiaMaltaMauritiusMexicoMiddle East & North AfricaMiddle East & North Africa (excluding high income)Middle East & North Africa (IDA & IBRD countries)Middle incomeMoldovaMongoliaMontenegroMoroccoMozambiqueMyanmarNamibiaNepalNetherlandsNew ZealandNicaraguaNigerNigeriaNorth AmericaNorwayOECD membersOmanOther small statesPakistanPanamaParaguayPeruPhilippinesPolandPortugalPost-demographic dividendPre-demographic dividendQatarRomaniaRussian FederationSaudi ArabiaSenegalSerbiaSingaporeSlovak RepublicSloveniaSmall statesSouth AfricaSouth AsiaSouth Asia (IDA & IBRD)South SudanSpainSri LankaSub-Saharan Africa Sub-Saharan Africa (excluding high income)Sub-Saharan Africa (IDA & IBRD countries)SudanSwedenSwitzerlandSyrian Arab RepublicTajikistanTanzaniaThailandTogoTrinidad and TobagoTunisiaTurkeyTurkmenistanUkraineUnited Arab EmiratesUnited KingdomUnited StatesUpper middle incomeUruguayUzbekistanVenezuela, RBVietnamWorldYemen, Rep.ZambiaZimbabwe Timeline:
This timeline shows a graph from 1961 to 2015 of Sweden. No data until 1960. Number of actual observations by date: 55.
Source name:
World Development Indicators
Source organization:
IEA Statistics © OECD/IEA 2014 (http://www.iea.org/stats/index.asp), subject to https://www.iea.org/t&c/termsandconditions/
Categories, topics:
Energy & Mining, Climate Change, Infrastructure
Last updated:
apr 23, 2017
Indicators value changes by year
Minimum:
36.792
jan 1, 1997
Maximum:
95.975
jan 1, 1963
At the date of observation
Value
Absolute change
Change from previous value
jan 1, 1961
88.82
+88.82
0.0%
jan 1, 1962
95.048
+6.229
7.01%
jan 1, 1963
95.975
+0.927
0.98%
jan 1, 1964
93.236
-2.739
-2.85%
jan 1, 1965
94.943
+1.706
1.83%
jan 1, 1966
94.567
-0.376
-0.4%
jan 1, 1967
89.857
-4.711
-4.98%
jan 1, 1968
91.572
+1.716
1.91%
jan 1, 1969
86.709
-4.863
-5.31%
jan 1, 1970
72.044
-14.665
-16.91%
jan 1, 1971
68.468
-3.575
-4.96%
jan 1, 1972
78.174
+9.705
14.17%
jan 1, 1973
75.005
-3.169
-4.05%
jan 1, 1974
76.7
+1.695
2.26%
jan 1, 1975
76.242
-0.458
-0.6%
jan 1, 1976
71.566
-4.675
-6.13%
jan 1, 1977
63.469
-8.097
-11.31%
jan 1, 1978
59.446
-4.023
-6.34%
jan 1, 1979
62.178
+2.731
4.59%
jan 1, 1980
64.25
+2.073
3.33%
jan 1, 1981
61.12
-3.13
-4.87%
jan 1, 1982
58.099
-3.02
-4.94%
jan 1, 1983
55.336
-2.763
-4.76%
jan 1, 1984
58.367
+3.031
5.48%
jan 1, 1985
55.088
-3.279
-5.62%
jan 1, 1986
51.991
-3.097
-5.62%
jan 1, 1987
44.123
-7.868
-15.13%
jan 1, 1988
49.219
+5.096
11.55%
jan 1, 1989
47.98
-1.239
-2.52%
jan 1, 1990
50.202
+2.222
4.63%
jan 1, 1991
49.665
-0.536
-1.07%
jan 1, 1992
43.026
-6.639
-13.37%
jan 1, 1993
50.935
+7.908
18.38%
jan 1, 1994
51.396
+0.461
0.91%
jan 1, 1995
41.416
-9.98
-19.42%
jan 1, 1996
45.924
+4.508
10.89%
jan 1, 1997
36.792
-9.132
-19.88%
jan 1, 1998
46.282
+9.49
25.79%
jan 1, 1999
47.232
+0.95
2.05%
jan 1, 2000
46.301
-0.931
-1.97%
jan 1, 2001
54.11
+7.809
16.87%
jan 1, 2002
48.925
-5.185
-9.58%
jan 1, 2003
45.235
-3.69
-7.54%
jan 1, 2004
39.548
-5.687
-12.57%
jan 1, 2005
39.64
+0.092
0.23%
jan 1, 2006
45.972
+6.332
15.97%
jan 1, 2007
43.077
-2.895
-6.3%
jan 1, 2008
44.455
+1.378
3.2%
jan 1, 2009
46.079
+1.624
3.65%
jan 1, 2010
48.206
+2.128
4.62%
jan 1, 2011
44.725
-3.482
-7.22%
jan 1, 2012
44.214
-0.51
-1.14%
jan 1, 2013
47.425
+3.21
7.26%
jan 1, 2014
40.097
-7.328
-15.45%
jan 1, 2015
41.775
+1.677
4.18%
Ranking of countries by current statistics by years


Comments: