29
/
en
AIzaSyAYiBZKx7MnpbEhh9jyipgxe19OcubqV5w
April 1, 2024
39837
IDA total
IDA
false
2
1
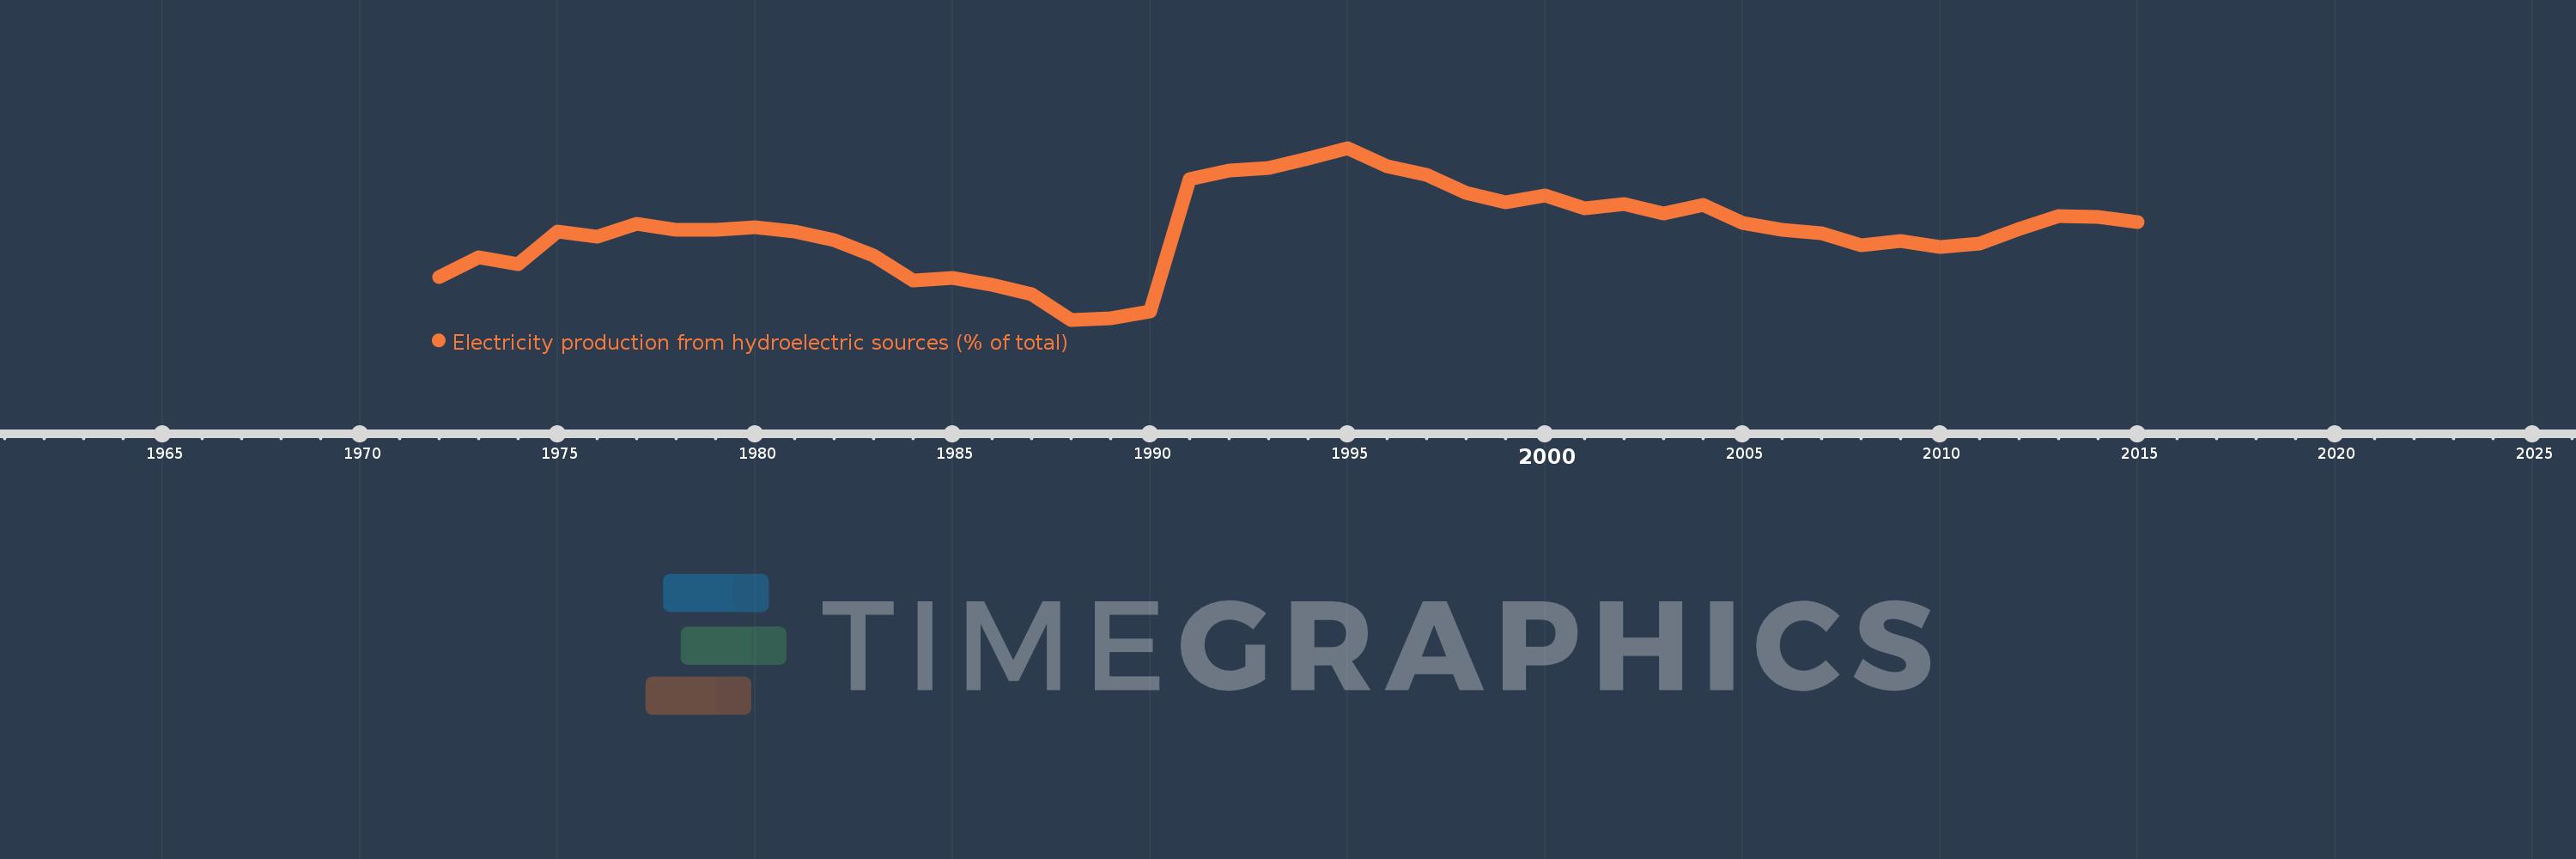
Electricity production from hydroelectric sources (% of total)
2015,2014,2013,2012,2011,2010,2009,2008,2007,2006,2005,2004,2003,2002,2001,2000,1999,1998,1997,1996,1995,1994,1993,1992,1991,1990,1989,1988,1987,1986,1985,1984,1983,1982,1981,1980,1979,1978,1977,1976,1975,1974,1973,1972
This statistics in other country:
AlbaniaAlgeriaAngolaArab WorldArgentinaArmeniaAustraliaAustriaAzerbaijanBahrainBangladeshBelarusBelgiumBeninBoliviaBosnia and HerzegovinaBotswanaBrazilBrunei DarussalamBulgariaCambodiaCameroonCanadaCentral Europe and the BalticsChileChinaColombiaCongo, Dem. Rep.Congo, Rep.Costa RicaCote d'IvoireCroatiaCubaCuracaoCyprusCzech RepublicDenmarkDominican RepublicEarly-demographic dividendEast Asia & PacificEast Asia & Pacific (excluding high income)East Asia & Pacific (IDA & IBRD countries)EcuadorEgypt, Arab Rep.El SalvadorEritreaEstoniaEthiopiaEuro areaEurope & Central AsiaEurope & Central Asia (excluding high income)Europe & Central Asia (IDA & IBRD countries)European UnionFinlandFragile and conflict affected situationsFranceGabonGeorgiaGermanyGhanaGibraltarGreeceGuatemalaHaitiHeavily indebted poor countries (HIPC)High incomeHondurasHong Kong SAR, ChinaHungaryIBRD onlyIcelandIDA & IBRD totalIDA blendIDA onlyIDA totalIndiaIndonesiaIran, Islamic Rep.IraqIrelandIsraelItalyJamaicaJapanJordanKazakhstanKenyaKorea, Dem. People’s Rep.Korea, Rep.KosovoKuwaitKyrgyz RepublicLate-demographic dividendLatin America & Caribbean Latin America & Caribbean (excluding high income)Latin America & the Caribbean (IDA & IBRD countries)LatviaLeast developed countries: UN classificationLebanonLibyaLithuaniaLow & middle incomeLower middle incomeLuxembourgMacedonia, FYRMalaysiaMaltaMauritiusMexicoMiddle East & North AfricaMiddle East & North Africa (excluding high income)Middle East & North Africa (IDA & IBRD countries)Middle incomeMoldovaMongoliaMontenegroMoroccoMozambiqueMyanmarNamibiaNepalNetherlandsNew ZealandNicaraguaNigerNigeriaNorth AmericaNorwayOECD membersOmanOther small statesPakistanPanamaParaguayPeruPhilippinesPolandPortugalPost-demographic dividendPre-demographic dividendQatarRomaniaRussian FederationSaudi ArabiaSenegalSerbiaSingaporeSlovak RepublicSloveniaSmall statesSouth AfricaSouth AsiaSouth Asia (IDA & IBRD)South SudanSpainSri LankaSub-Saharan Africa Sub-Saharan Africa (excluding high income)Sub-Saharan Africa (IDA & IBRD countries)SudanSwedenSwitzerlandSyrian Arab RepublicTajikistanTanzaniaThailandTogoTrinidad and TobagoTunisiaTurkeyTurkmenistanUkraineUnited Arab EmiratesUnited KingdomUnited StatesUpper middle incomeUruguayUzbekistanVenezuela, RBVietnamWorldYemen, Rep.ZambiaZimbabwe Timeline:
This timeline shows a graph from 1972 to 2015 of IDA total. No data until 1971. Number of actual observations by date: 44.
Source name:
World Development Indicators
Source organization:
IEA Statistics © OECD/IEA 2014 (http://www.iea.org/stats/index.asp), subject to https://www.iea.org/t&c/termsandconditions/
Categories, topics:
Energy & Mining, Climate Change, Infrastructure
Last updated:
apr 23, 2017
Indicators value changes by year
Minimum:
26.274
jan 1, 1988
Maximum:
41.592
jan 1, 1995
At the date of observation
Value
Absolute change
Change from previous value
jan 1, 1972
30.067
+30.067
0.0%
jan 1, 1973
31.818
+1.751
5.83%
jan 1, 1974
31.237
-0.581
-1.83%
jan 1, 1975
34.132
+2.894
9.27%
jan 1, 1976
33.707
-0.424
-1.24%
jan 1, 1977
34.827
+1.119
3.32%
jan 1, 1978
34.307
-0.52
-1.49%
jan 1, 1979
34.288
-0.019
-0.06%
jan 1, 1980
34.518
+0.23
0.67%
jan 1, 1981
34.102
-0.416
-1.2%
jan 1, 1982
33.349
-0.753
-2.21%
jan 1, 1983
31.974
-1.376
-4.13%
jan 1, 1984
29.805
-2.169
-6.78%
jan 1, 1985
29.989
+0.184
0.62%
jan 1, 1986
29.385
-0.604
-2.02%
jan 1, 1987
28.522
-0.862
-2.94%
jan 1, 1988
26.274
-2.248
-7.88%
jan 1, 1989
26.372
+0.098
0.37%
jan 1, 1990
27.021
+0.649
2.46%
jan 1, 1991
38.815
+11.793
43.64%
jan 1, 1992
39.578
+0.763
1.97%
jan 1, 1993
39.844
+0.266
0.67%
jan 1, 1994
40.634
+0.79
1.98%
jan 1, 1995
41.592
+0.959
2.36%
jan 1, 1996
39.941
-1.651
-3.97%
jan 1, 1997
39.185
-0.756
-1.89%
jan 1, 1998
37.608
-1.577
-4.02%
jan 1, 1999
36.747
-0.861
-2.29%
jan 1, 2000
37.345
+0.598
1.63%
jan 1, 2001
36.203
-1.143
-3.06%
jan 1, 2002
36.598
+0.395
1.09%
jan 1, 2003
35.781
-0.817
-2.23%
jan 1, 2004
36.548
+0.767
2.14%
jan 1, 2005
34.876
-1.672
-4.57%
jan 1, 2006
34.262
-0.614
-1.76%
jan 1, 2007
33.982
-0.28
-0.82%
jan 1, 2008
32.89
-1.092
-3.21%
jan 1, 2009
33.322
+0.433
1.32%
jan 1, 2010
32.757
-0.565
-1.7%
jan 1, 2011
33.078
+0.32
0.98%
jan 1, 2012
34.354
+1.276
3.86%
jan 1, 2013
35.516
+1.162
3.38%
jan 1, 2014
35.409
-0.108
-0.3%
jan 1, 2015
34.996
-0.413
-1.17%
Ranking of countries by current statistics by years


Comments: