29
/
en
AIzaSyAYiBZKx7MnpbEhh9jyipgxe19OcubqV5w
April 1, 2024
130339
Ethiopia
ETH
true
2
1
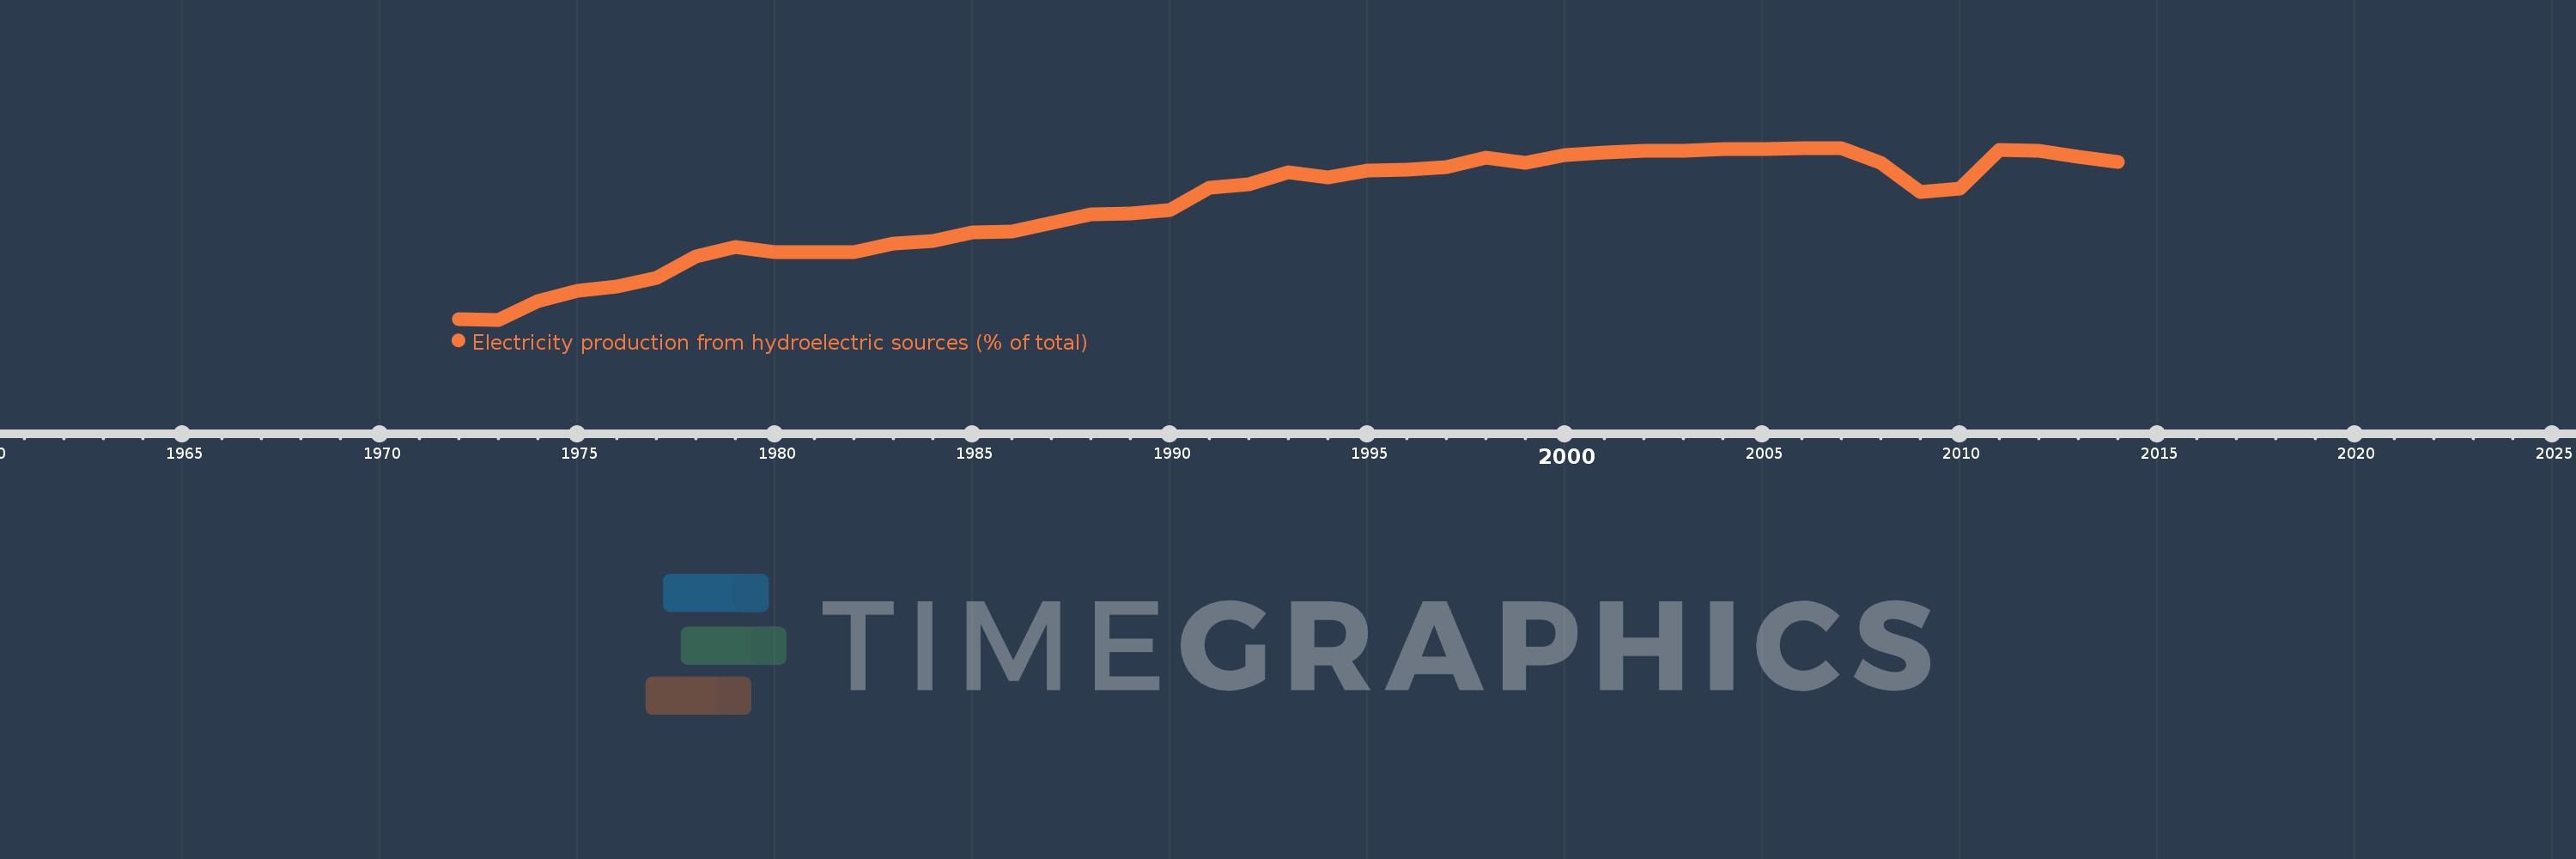
Electricity production from hydroelectric sources (% of total)
2014,2013,2012,2011,2010,2009,2008,2007,2006,2005,2004,2003,2002,2001,2000,1999,1998,1997,1996,1995,1994,1993,1992,1991,1990,1989,1988,1987,1986,1985,1984,1983,1982,1981,1980,1979,1978,1977,1976,1975,1974,1973,1972
This statistics in other country:
AlbaniaAlgeriaAngolaArab WorldArgentinaArmeniaAustraliaAustriaAzerbaijanBahrainBangladeshBelarusBelgiumBeninBoliviaBosnia and HerzegovinaBotswanaBrazilBrunei DarussalamBulgariaCambodiaCameroonCanadaCentral Europe and the BalticsChileChinaColombiaCongo, Dem. Rep.Congo, Rep.Costa RicaCote d'IvoireCroatiaCubaCuracaoCyprusCzech RepublicDenmarkDominican RepublicEarly-demographic dividendEast Asia & PacificEast Asia & Pacific (excluding high income)East Asia & Pacific (IDA & IBRD countries)EcuadorEgypt, Arab Rep.El SalvadorEritreaEstoniaEthiopiaEuro areaEurope & Central AsiaEurope & Central Asia (excluding high income)Europe & Central Asia (IDA & IBRD countries)European UnionFinlandFragile and conflict affected situationsFranceGabonGeorgiaGermanyGhanaGibraltarGreeceGuatemalaHaitiHeavily indebted poor countries (HIPC)High incomeHondurasHong Kong SAR, ChinaHungaryIBRD onlyIcelandIDA & IBRD totalIDA blendIDA onlyIDA totalIndiaIndonesiaIran, Islamic Rep.IraqIrelandIsraelItalyJamaicaJapanJordanKazakhstanKenyaKorea, Dem. People’s Rep.Korea, Rep.KosovoKuwaitKyrgyz RepublicLate-demographic dividendLatin America & Caribbean Latin America & Caribbean (excluding high income)Latin America & the Caribbean (IDA & IBRD countries)LatviaLeast developed countries: UN classificationLebanonLibyaLithuaniaLow & middle incomeLower middle incomeLuxembourgMacedonia, FYRMalaysiaMaltaMauritiusMexicoMiddle East & North AfricaMiddle East & North Africa (excluding high income)Middle East & North Africa (IDA & IBRD countries)Middle incomeMoldovaMongoliaMontenegroMoroccoMozambiqueMyanmarNamibiaNepalNetherlandsNew ZealandNicaraguaNigerNigeriaNorth AmericaNorwayOECD membersOmanOther small statesPakistanPanamaParaguayPeruPhilippinesPolandPortugalPost-demographic dividendPre-demographic dividendQatarRomaniaRussian FederationSaudi ArabiaSenegalSerbiaSingaporeSlovak RepublicSloveniaSmall statesSouth AfricaSouth AsiaSouth Asia (IDA & IBRD)South SudanSpainSri LankaSub-Saharan Africa Sub-Saharan Africa (excluding high income)Sub-Saharan Africa (IDA & IBRD countries)SudanSwedenSwitzerlandSyrian Arab RepublicTajikistanTanzaniaThailandTogoTrinidad and TobagoTunisiaTurkeyTurkmenistanUkraineUnited Arab EmiratesUnited KingdomUnited StatesUpper middle incomeUruguayUzbekistanVenezuela, RBVietnamWorldYemen, Rep.ZambiaZimbabwe Timeline:
This timeline shows a graph from 1972 to 2014 of Ethiopia. No data until 1971. Number of actual observations by date: 43.
Source name:
World Development Indicators
Source organization:
IEA Statistics © OECD/IEA 2014 (http://www.iea.org/stats/index.asp), subject to https://www.iea.org/t&c/termsandconditions/
Categories, topics:
Energy & Mining, Climate Change, Infrastructure
Last updated:
apr 23, 2017
Indicators value changes by year
Minimum:
51.064
jan 1, 1973
Maximum:
99.694
jan 1, 2007
At the date of observation
Value
Absolute change
Change from previous value
jan 1, 1972
51.265
+51.265
0.0%
jan 1, 1973
51.064
-0.201
-0.39%
jan 1, 1974
56.345
+5.281
10.34%
jan 1, 1975
59.284
+2.939
5.22%
jan 1, 1976
60.381
+1.096
1.85%
jan 1, 1977
63.021
+2.64
4.37%
jan 1, 1978
69.061
+6.04
9.58%
jan 1, 1979
71.605
+2.544
3.68%
jan 1, 1980
70.128
-1.477
-2.06%
jan 1, 1981
70.247
+0.119
0.17%
jan 1, 1982
70.319
+0.072
0.1%
jan 1, 1983
72.682
+2.363
3.36%
jan 1, 1984
73.256
+0.574
0.79%
jan 1, 1985
75.824
+2.568
3.51%
jan 1, 1986
76.014
+0.189
0.25%
jan 1, 1987
78.361
+2.347
3.09%
jan 1, 1988
80.83
+2.469
3.15%
jan 1, 1989
81.186
+0.356
0.44%
jan 1, 1990
82.025
+0.839
1.03%
jan 1, 1991
88.353
+6.328
7.71%
jan 1, 1992
89.495
+1.143
1.29%
jan 1, 1993
92.748
+3.252
3.63%
jan 1, 1994
91.323
-1.425
-1.54%
jan 1, 1995
93.315
+1.992
2.18%
jan 1, 1996
93.517
+0.202
0.22%
jan 1, 1997
94.198
+0.682
0.73%
jan 1, 1998
97.026
+2.828
3.0%
jan 1, 1999
95.523
-1.503
-1.55%
jan 1, 2000
97.628
+2.104
2.2%
jan 1, 2001
98.327
+0.7
0.72%
jan 1, 2002
99.006
+0.679
0.69%
jan 1, 2003
98.973
-0.033
-0.03%
jan 1, 2004
99.303
+0.331
0.33%
jan 1, 2005
99.291
-0.012
-0.01%
jan 1, 2006
99.578
+0.287
0.29%
jan 1, 2007
99.694
+0.116
0.12%
jan 1, 2008
95.433
-4.261
-4.27%
jan 1, 2009
87.265
-8.168
-8.56%
jan 1, 2010
88.277
+1.012
1.16%
jan 1, 2011
99.016
+10.74
12.17%
jan 1, 2012
98.832
-0.184
-0.19%
jan 1, 2013
97.108
-1.724
-1.74%
jan 1, 2014
95.63
-1.478
-1.52%
Ranking of countries by current statistics by years


Comments: