29
/
en
AIzaSyAYiBZKx7MnpbEhh9jyipgxe19OcubqV5w
April 1, 2024
167372
Kenya
KEN
true
2
1
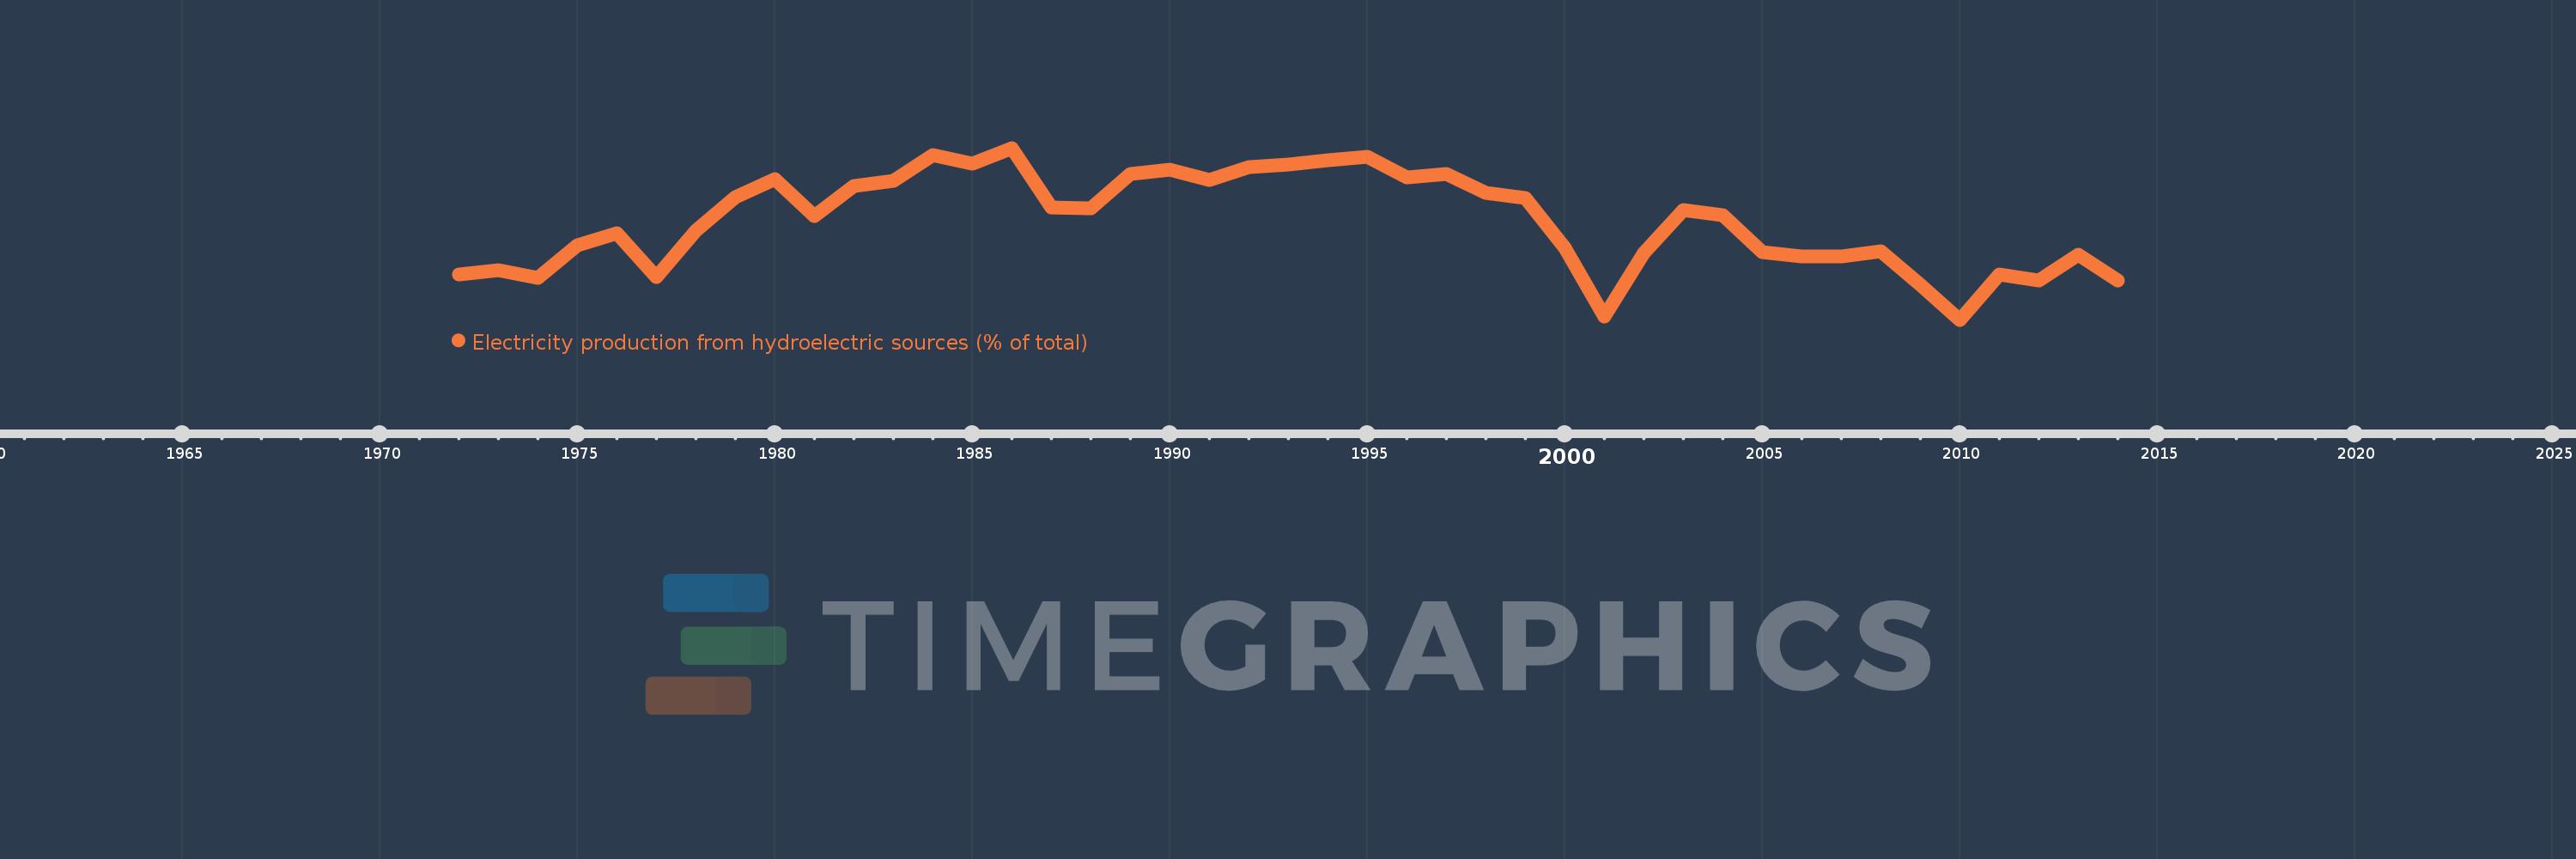
Electricity production from hydroelectric sources (% of total)
2014,2013,2012,2011,2010,2009,2008,2007,2006,2005,2004,2003,2002,2001,2000,1999,1998,1997,1996,1995,1994,1993,1992,1991,1990,1989,1988,1987,1986,1985,1984,1983,1982,1981,1980,1979,1978,1977,1976,1975,1974,1973,1972
This statistics in other country:
AlbaniaAlgeriaAngolaArab WorldArgentinaArmeniaAustraliaAustriaAzerbaijanBahrainBangladeshBelarusBelgiumBeninBoliviaBosnia and HerzegovinaBotswanaBrazilBrunei DarussalamBulgariaCambodiaCameroonCanadaCentral Europe and the BalticsChileChinaColombiaCongo, Dem. Rep.Congo, Rep.Costa RicaCote d'IvoireCroatiaCubaCuracaoCyprusCzech RepublicDenmarkDominican RepublicEarly-demographic dividendEast Asia & PacificEast Asia & Pacific (excluding high income)East Asia & Pacific (IDA & IBRD countries)EcuadorEgypt, Arab Rep.El SalvadorEritreaEstoniaEthiopiaEuro areaEurope & Central AsiaEurope & Central Asia (excluding high income)Europe & Central Asia (IDA & IBRD countries)European UnionFinlandFragile and conflict affected situationsFranceGabonGeorgiaGermanyGhanaGibraltarGreeceGuatemalaHaitiHeavily indebted poor countries (HIPC)High incomeHondurasHong Kong SAR, ChinaHungaryIBRD onlyIcelandIDA & IBRD totalIDA blendIDA onlyIDA totalIndiaIndonesiaIran, Islamic Rep.IraqIrelandIsraelItalyJamaicaJapanJordanKazakhstanKenyaKorea, Dem. People’s Rep.Korea, Rep.KosovoKuwaitKyrgyz RepublicLate-demographic dividendLatin America & Caribbean Latin America & Caribbean (excluding high income)Latin America & the Caribbean (IDA & IBRD countries)LatviaLeast developed countries: UN classificationLebanonLibyaLithuaniaLow & middle incomeLower middle incomeLuxembourgMacedonia, FYRMalaysiaMaltaMauritiusMexicoMiddle East & North AfricaMiddle East & North Africa (excluding high income)Middle East & North Africa (IDA & IBRD countries)Middle incomeMoldovaMongoliaMontenegroMoroccoMozambiqueMyanmarNamibiaNepalNetherlandsNew ZealandNicaraguaNigerNigeriaNorth AmericaNorwayOECD membersOmanOther small statesPakistanPanamaParaguayPeruPhilippinesPolandPortugalPost-demographic dividendPre-demographic dividendQatarRomaniaRussian FederationSaudi ArabiaSenegalSerbiaSingaporeSlovak RepublicSloveniaSmall statesSouth AfricaSouth AsiaSouth Asia (IDA & IBRD)South SudanSpainSri LankaSub-Saharan Africa Sub-Saharan Africa (excluding high income)Sub-Saharan Africa (IDA & IBRD countries)SudanSwedenSwitzerlandSyrian Arab RepublicTajikistanTanzaniaThailandTogoTrinidad and TobagoTunisiaTurkeyTurkmenistanUkraineUnited Arab EmiratesUnited KingdomUnited StatesUpper middle incomeUruguayUzbekistanVenezuela, RBVietnamWorldYemen, Rep.ZambiaZimbabwe Timeline:
This timeline shows a graph from 1972 to 2014 of Kenya. No data until 1971. Number of actual observations by date: 43.
Source name:
World Development Indicators
Source organization:
IEA Statistics © OECD/IEA 2014 (http://www.iea.org/stats/index.asp), subject to https://www.iea.org/t&c/termsandconditions/
Categories, topics:
Energy & Mining, Climate Change, Infrastructure
Last updated:
apr 23, 2017
Indicators value changes by year
Maximum:
86.747
jan 1, 1986
At the date of observation
Value
Absolute change
Change from previous value
jan 1, 1972
46.566
+46.566
0.0%
jan 1, 1973
47.852
+1.286
2.76%
jan 1, 1974
45.283
-2.569
-5.37%
jan 1, 1975
55.703
+10.42
23.01%
jan 1, 1976
59.706
+4.003
7.19%
jan 1, 1977
45.582
-14.123
-23.65%
jan 1, 1978
60.501
+14.918
32.73%
jan 1, 1979
70.966
+10.465
17.3%
jan 1, 1980
76.806
+5.84
8.23%
jan 1, 1981
65.031
-11.775
-15.33%
jan 1, 1982
74.737
+9.706
14.93%
jan 1, 1983
76.329
+1.592
2.13%
jan 1, 1984
84.425
+8.096
10.61%
jan 1, 1985
81.629
-2.796
-3.31%
jan 1, 1986
86.747
+5.118
6.27%
jan 1, 1987
67.66
-19.087
-22.0%
jan 1, 1988
67.384
-0.276
-0.41%
jan 1, 1989
78.48
+11.096
16.47%
jan 1, 1990
79.748
+1.268
1.62%
jan 1, 1991
76.569
-3.179
-3.99%
jan 1, 1992
80.664
+4.095
5.35%
jan 1, 1993
81.54
+0.876
1.09%
jan 1, 1994
82.771
+1.231
1.51%
jan 1, 1995
83.802
+1.031
1.25%
jan 1, 1996
77.316
-6.486
-7.74%
jan 1, 1997
78.456
+1.14
1.47%
jan 1, 1998
72.567
-5.889
-7.51%
jan 1, 1999
70.896
-1.671
-2.3%
jan 1, 2000
54.979
-15.918
-22.45%
jan 1, 2001
33.075
-21.903
-39.84%
jan 1, 2002
53.234
+20.159
60.95%
jan 1, 2003
67.09
+13.855
26.03%
jan 1, 2004
65.383
-1.707
-2.54%
jan 1, 2005
53.436
-11.947
-18.27%
jan 1, 2006
52.127
-1.309
-2.45%
jan 1, 2007
52.214
+0.087
0.17%
jan 1, 2008
53.835
+1.621
3.11%
jan 1, 2009
43.298
-10.538
-19.57%
jan 1, 2010
32.03
-11.268
-26.03%
jan 1, 2011
46.348
+14.319
44.71%
jan 1, 2012
44.5
-1.848
-3.99%
jan 1, 2013
52.639
+8.138
18.29%
jan 1, 2014
44.446
-8.193
-15.56%
Ranking of countries by current statistics by years


Comments: