29
/
en
AIzaSyAYiBZKx7MnpbEhh9jyipgxe19OcubqV5w
April 1, 2024
42278
Latin America & Caribbean (excluding high income)
LAC
false
2
1
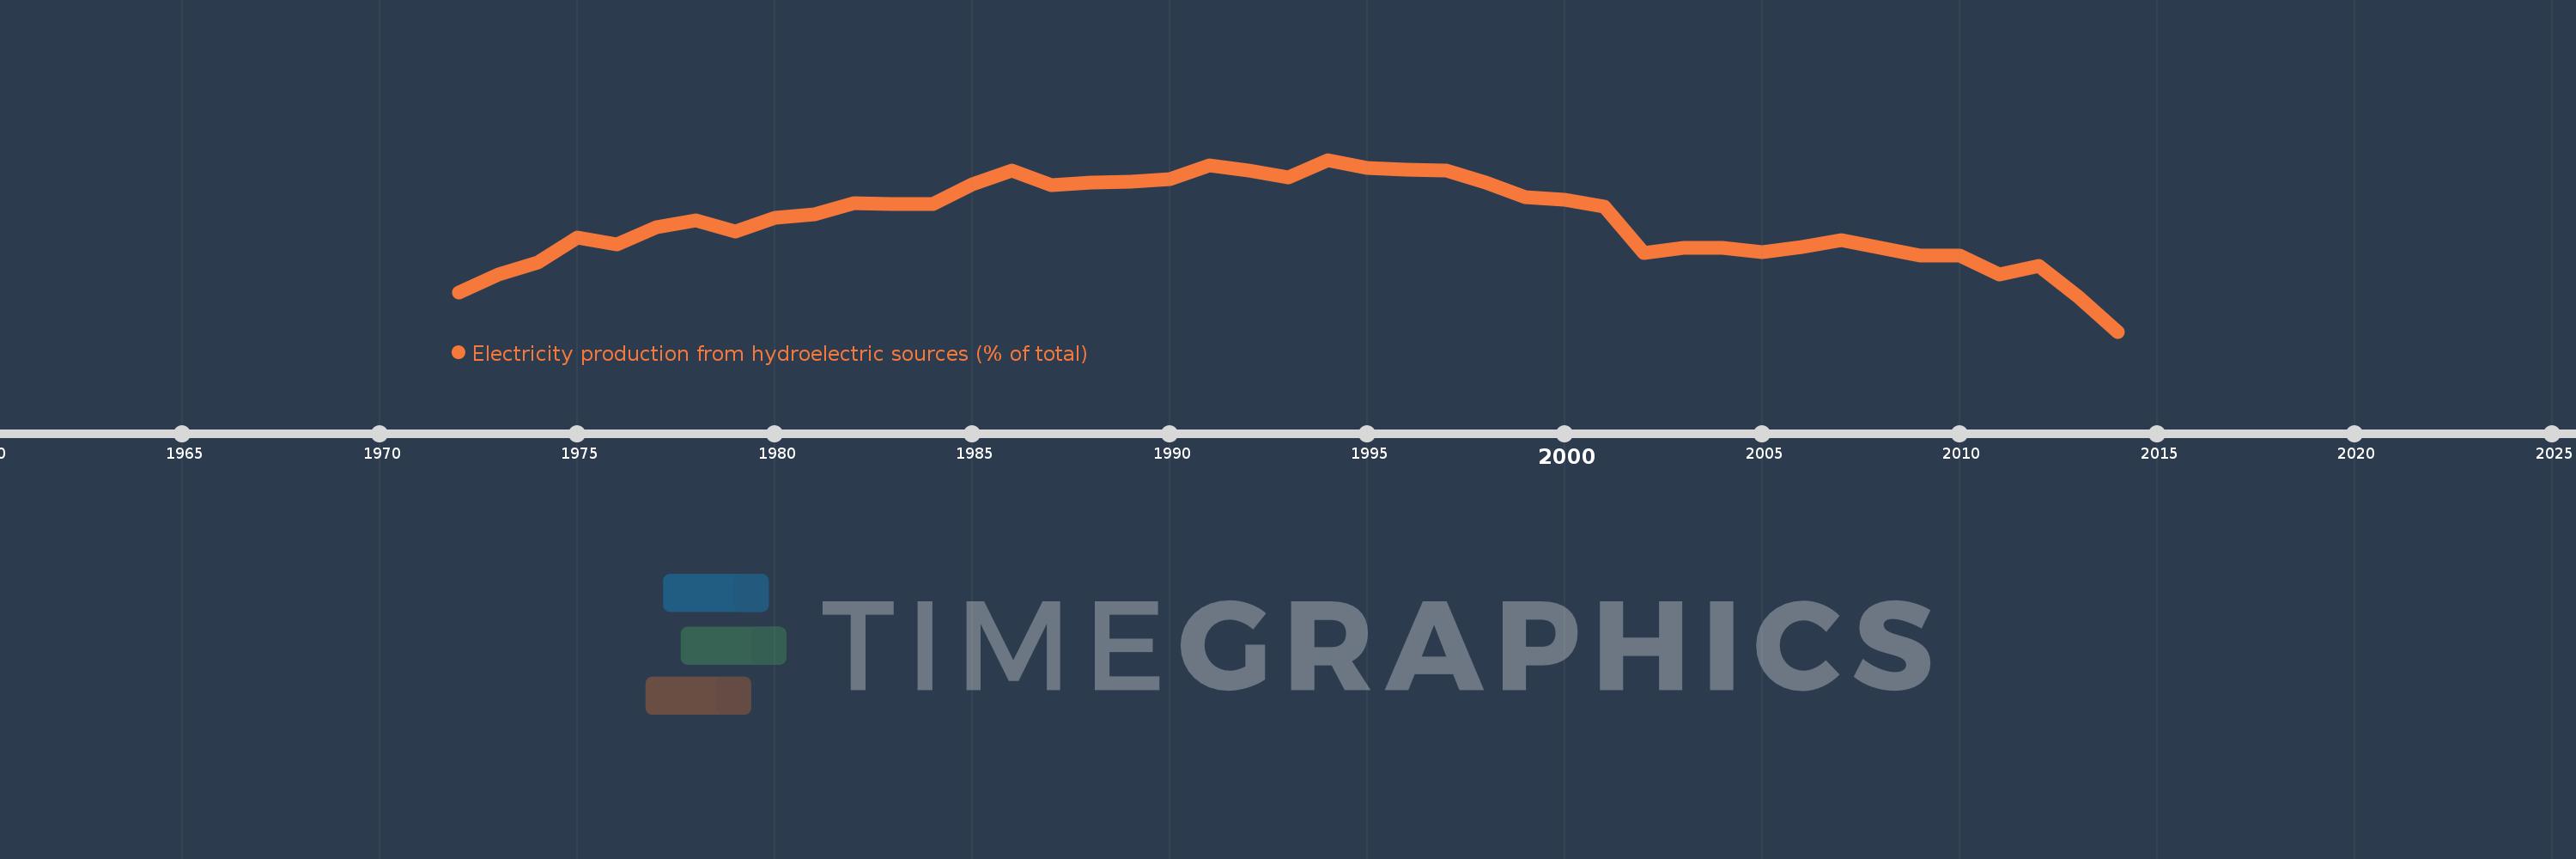
Electricity production from hydroelectric sources (% of total)
2014,2013,2012,2011,2010,2009,2008,2007,2006,2005,2004,2003,2002,2001,2000,1999,1998,1997,1996,1995,1994,1993,1992,1991,1990,1989,1988,1987,1986,1985,1984,1983,1982,1981,1980,1979,1978,1977,1976,1975,1974,1973,1972
This statistics in other country:
AlbaniaAlgeriaAngolaArab WorldArgentinaArmeniaAustraliaAustriaAzerbaijanBahrainBangladeshBelarusBelgiumBeninBoliviaBosnia and HerzegovinaBotswanaBrazilBrunei DarussalamBulgariaCambodiaCameroonCanadaCentral Europe and the BalticsChileChinaColombiaCongo, Dem. Rep.Congo, Rep.Costa RicaCote d'IvoireCroatiaCubaCuracaoCyprusCzech RepublicDenmarkDominican RepublicEarly-demographic dividendEast Asia & PacificEast Asia & Pacific (excluding high income)East Asia & Pacific (IDA & IBRD countries)EcuadorEgypt, Arab Rep.El SalvadorEritreaEstoniaEthiopiaEuro areaEurope & Central AsiaEurope & Central Asia (excluding high income)Europe & Central Asia (IDA & IBRD countries)European UnionFinlandFragile and conflict affected situationsFranceGabonGeorgiaGermanyGhanaGibraltarGreeceGuatemalaHaitiHeavily indebted poor countries (HIPC)High incomeHondurasHong Kong SAR, ChinaHungaryIBRD onlyIcelandIDA & IBRD totalIDA blendIDA onlyIDA totalIndiaIndonesiaIran, Islamic Rep.IraqIrelandIsraelItalyJamaicaJapanJordanKazakhstanKenyaKorea, Dem. People’s Rep.Korea, Rep.KosovoKuwaitKyrgyz RepublicLate-demographic dividendLatin America & Caribbean Latin America & Caribbean (excluding high income)Latin America & the Caribbean (IDA & IBRD countries)LatviaLeast developed countries: UN classificationLebanonLibyaLithuaniaLow & middle incomeLower middle incomeLuxembourgMacedonia, FYRMalaysiaMaltaMauritiusMexicoMiddle East & North AfricaMiddle East & North Africa (excluding high income)Middle East & North Africa (IDA & IBRD countries)Middle incomeMoldovaMongoliaMontenegroMoroccoMozambiqueMyanmarNamibiaNepalNetherlandsNew ZealandNicaraguaNigerNigeriaNorth AmericaNorwayOECD membersOmanOther small statesPakistanPanamaParaguayPeruPhilippinesPolandPortugalPost-demographic dividendPre-demographic dividendQatarRomaniaRussian FederationSaudi ArabiaSenegalSerbiaSingaporeSlovak RepublicSloveniaSmall statesSouth AfricaSouth AsiaSouth Asia (IDA & IBRD)South SudanSpainSri LankaSub-Saharan Africa Sub-Saharan Africa (excluding high income)Sub-Saharan Africa (IDA & IBRD countries)SudanSwedenSwitzerlandSyrian Arab RepublicTajikistanTanzaniaThailandTogoTrinidad and TobagoTunisiaTurkeyTurkmenistanUkraineUnited Arab EmiratesUnited KingdomUnited StatesUpper middle incomeUruguayUzbekistanVenezuela, RBVietnamWorldYemen, Rep.ZambiaZimbabwe Timeline:
This timeline shows a graph from 1972 to 2014 of Latin America & Caribbean (excluding high income). No data until 1971. Number of actual observations by date: 43.
Source name:
World Development Indicators
Source organization:
IEA Statistics © OECD/IEA 2014 (http://www.iea.org/stats/index.asp), subject to https://www.iea.org/t&c/termsandconditions/
Categories, topics:
Energy & Mining, Climate Change, Infrastructure
Last updated:
apr 23, 2017
Indicators value changes by year
Minimum:
49.214
jan 1, 2014
Maximum:
64.967
jan 1, 1994
At the date of observation
Value
Absolute change
Change from previous value
jan 1, 1972
52.793
+52.793
0.0%
jan 1, 1973
54.474
+1.681
3.18%
jan 1, 1974
55.521
+1.047
1.92%
jan 1, 1975
57.856
+2.335
4.2%
jan 1, 1976
57.211
-0.645
-1.11%
jan 1, 1977
58.779
+1.568
2.74%
jan 1, 1978
59.376
+0.597
1.02%
jan 1, 1979
58.424
-0.951
-1.6%
jan 1, 1980
59.632
+1.207
2.07%
jan 1, 1981
59.962
+0.33
0.55%
jan 1, 1982
60.97
+1.008
1.68%
jan 1, 1983
60.915
-0.054
-0.09%
jan 1, 1984
60.883
-0.032
-0.05%
jan 1, 1985
62.709
+1.826
3.0%
jan 1, 1986
63.952
+1.243
1.98%
jan 1, 1987
62.649
-1.303
-2.04%
jan 1, 1988
62.89
+0.241
0.38%
jan 1, 1989
62.937
+0.047
0.08%
jan 1, 1990
63.184
+0.247
0.39%
jan 1, 1991
64.485
+1.302
2.06%
jan 1, 1992
63.95
-0.536
-0.83%
jan 1, 1993
63.353
-0.596
-0.93%
jan 1, 1994
64.967
+1.614
2.55%
jan 1, 1995
64.189
-0.778
-1.2%
jan 1, 1996
64.083
-0.106
-0.17%
jan 1, 1997
63.972
-0.111
-0.17%
jan 1, 1998
62.909
-1.063
-1.66%
jan 1, 1999
61.528
-1.381
-2.19%
jan 1, 2000
61.29
-0.238
-0.39%
jan 1, 2001
60.646
-0.645
-1.05%
jan 1, 2002
56.404
-4.241
-6.99%
jan 1, 2003
56.913
+0.509
0.9%
jan 1, 2004
56.904
-0.009
-0.02%
jan 1, 2005
56.498
-0.407
-0.71%
jan 1, 2006
57.009
+0.511
0.91%
jan 1, 2007
57.581
+0.572
1.0%
jan 1, 2008
56.923
-0.658
-1.14%
jan 1, 2009
56.159
-0.764
-1.34%
jan 1, 2010
56.176
+0.017
0.03%
jan 1, 2011
54.414
-1.762
-3.14%
jan 1, 2012
55.232
+0.817
1.5%
jan 1, 2013
52.439
-2.793
-5.06%
jan 1, 2014
49.214
-3.225
-6.15%
Ranking of countries by current statistics by years


Comments: