29
/
en
AIzaSyAYiBZKx7MnpbEhh9jyipgxe19OcubqV5w
April 1, 2024
72871
Australia
AUS
true
2
1
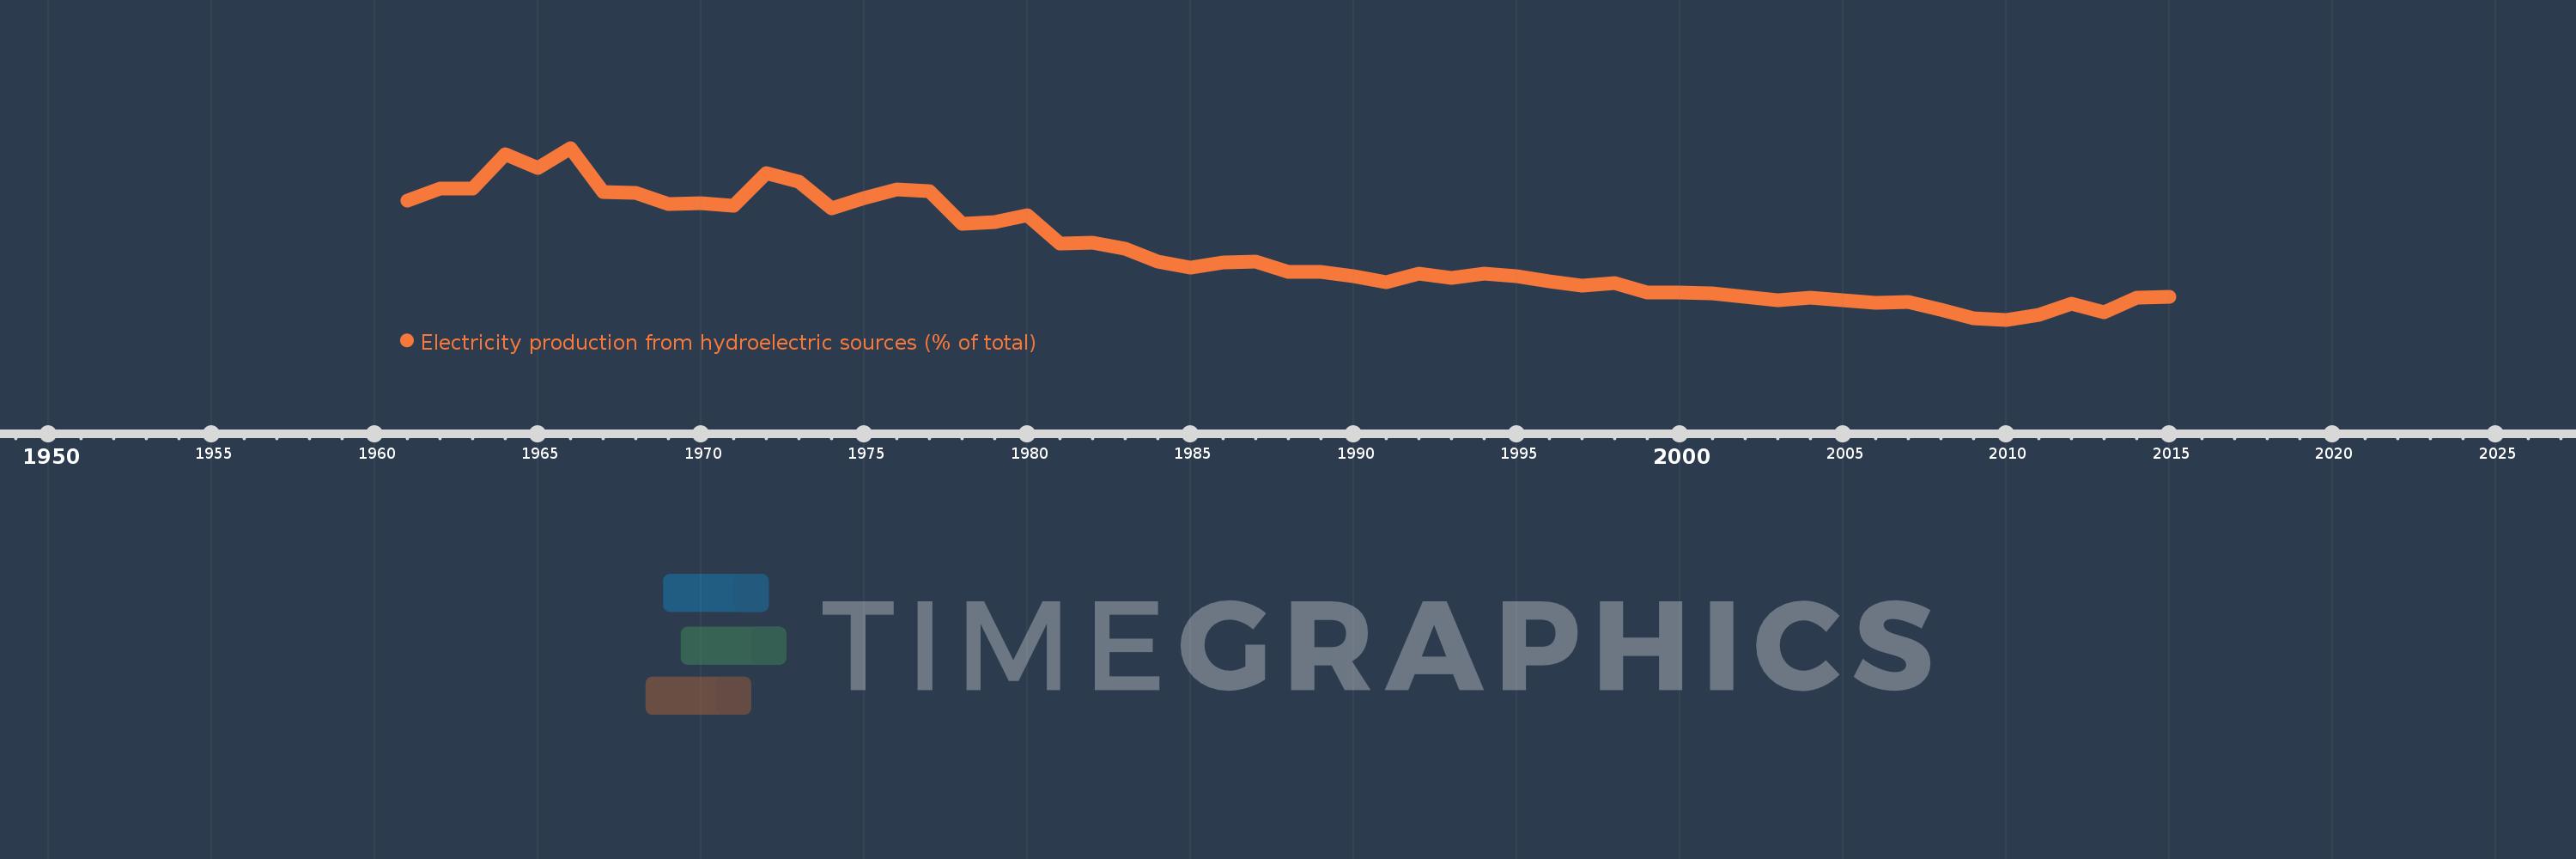
Electricity production from hydroelectric sources (% of total)
2015,2014,2013,2012,2011,2010,2009,2008,2007,2006,2005,2004,2003,2002,2001,2000,1999,1998,1997,1996,1995,1994,1993,1992,1991,1990,1989,1988,1987,1986,1985,1984,1983,1982,1981,1980,1979,1978,1977,1976,1975,1974,1973,1972,1971,1970,1969,1968,1967,1966,1965,1964,1963,1962,1961
This statistics in other country:
AlbaniaAlgeriaAngolaArab WorldArgentinaArmeniaAustraliaAustriaAzerbaijanBahrainBangladeshBelarusBelgiumBeninBoliviaBosnia and HerzegovinaBotswanaBrazilBrunei DarussalamBulgariaCambodiaCameroonCanadaCentral Europe and the BalticsChileChinaColombiaCongo, Dem. Rep.Congo, Rep.Costa RicaCote d'IvoireCroatiaCubaCuracaoCyprusCzech RepublicDenmarkDominican RepublicEarly-demographic dividendEast Asia & PacificEast Asia & Pacific (excluding high income)East Asia & Pacific (IDA & IBRD countries)EcuadorEgypt, Arab Rep.El SalvadorEritreaEstoniaEthiopiaEuro areaEurope & Central AsiaEurope & Central Asia (excluding high income)Europe & Central Asia (IDA & IBRD countries)European UnionFinlandFragile and conflict affected situationsFranceGabonGeorgiaGermanyGhanaGibraltarGreeceGuatemalaHaitiHeavily indebted poor countries (HIPC)High incomeHondurasHong Kong SAR, ChinaHungaryIBRD onlyIcelandIDA & IBRD totalIDA blendIDA onlyIDA totalIndiaIndonesiaIran, Islamic Rep.IraqIrelandIsraelItalyJamaicaJapanJordanKazakhstanKenyaKorea, Dem. People’s Rep.Korea, Rep.KosovoKuwaitKyrgyz RepublicLate-demographic dividendLatin America & Caribbean Latin America & Caribbean (excluding high income)Latin America & the Caribbean (IDA & IBRD countries)LatviaLeast developed countries: UN classificationLebanonLibyaLithuaniaLow & middle incomeLower middle incomeLuxembourgMacedonia, FYRMalaysiaMaltaMauritiusMexicoMiddle East & North AfricaMiddle East & North Africa (excluding high income)Middle East & North Africa (IDA & IBRD countries)Middle incomeMoldovaMongoliaMontenegroMoroccoMozambiqueMyanmarNamibiaNepalNetherlandsNew ZealandNicaraguaNigerNigeriaNorth AmericaNorwayOECD membersOmanOther small statesPakistanPanamaParaguayPeruPhilippinesPolandPortugalPost-demographic dividendPre-demographic dividendQatarRomaniaRussian FederationSaudi ArabiaSenegalSerbiaSingaporeSlovak RepublicSloveniaSmall statesSouth AfricaSouth AsiaSouth Asia (IDA & IBRD)South SudanSpainSri LankaSub-Saharan Africa Sub-Saharan Africa (excluding high income)Sub-Saharan Africa (IDA & IBRD countries)SudanSwedenSwitzerlandSyrian Arab RepublicTajikistanTanzaniaThailandTogoTrinidad and TobagoTunisiaTurkeyTurkmenistanUkraineUnited Arab EmiratesUnited KingdomUnited StatesUpper middle incomeUruguayUzbekistanVenezuela, RBVietnamWorldYemen, Rep.ZambiaZimbabwe Timeline:
This timeline shows a graph from 1961 to 2015 of Australia. No data until 1960. Number of actual observations by date: 55.
Source name:
World Development Indicators
Source organization:
IEA Statistics © OECD/IEA 2014 (http://www.iea.org/stats/index.asp), subject to https://www.iea.org/t&c/termsandconditions/
Categories, topics:
Energy & Mining, Climate Change, Infrastructure
Last updated:
apr 23, 2017
Indicators value changes by year
Maximum:
24.784
jan 1, 1966
At the date of observation
Value
Absolute change
Change from previous value
jan 1, 1961
18.64
+18.64
0.0%
jan 1, 1962
20.041
+1.401
7.52%
jan 1, 1963
20.029
-0.011
-0.06%
jan 1, 1964
24.096
+4.067
20.3%
jan 1, 1965
22.481
-1.615
-6.7%
jan 1, 1966
24.784
+2.303
10.25%
jan 1, 1967
19.635
-5.149
-20.77%
jan 1, 1968
19.582
-0.053
-0.27%
jan 1, 1969
18.215
-1.367
-6.98%
jan 1, 1970
18.357
+0.142
0.78%
jan 1, 1971
17.999
-0.358
-1.95%
jan 1, 1972
21.832
+3.834
21.3%
jan 1, 1973
20.821
-1.011
-4.63%
jan 1, 1974
17.716
-3.105
-14.91%
jan 1, 1975
18.965
+1.249
7.05%
jan 1, 1976
19.957
+0.992
5.23%
jan 1, 1977
19.721
-0.236
-1.18%
jan 1, 1978
15.938
-3.782
-19.18%
jan 1, 1979
16.181
+0.242
1.52%
jan 1, 1980
16.956
+0.775
4.79%
jan 1, 1981
13.59
-3.366
-19.85%
jan 1, 1982
13.772
+0.182
1.34%
jan 1, 1983
13.021
-0.751
-5.45%
jan 1, 1984
11.498
-1.524
-11.7%
jan 1, 1985
10.839
-0.659
-5.73%
jan 1, 1986
11.417
+0.578
5.34%
jan 1, 1987
11.567
+0.15
1.31%
jan 1, 1988
10.338
-1.229
-10.62%
jan 1, 1989
10.339
+0.001
0.01%
jan 1, 1990
9.828
-0.511
-4.94%
jan 1, 1991
9.17
-0.658
-6.69%
jan 1, 1992
10.107
+0.937
10.22%
jan 1, 1993
9.646
-0.461
-4.56%
jan 1, 1994
10.132
+0.486
5.04%
jan 1, 1995
9.784
-0.348
-3.44%
jan 1, 1996
9.192
-0.591
-6.04%
jan 1, 1997
8.692
-0.501
-5.45%
jan 1, 1998
9.043
+0.351
4.04%
jan 1, 1999
7.888
-1.155
-12.77%
jan 1, 2000
7.957
+0.069
0.88%
jan 1, 2001
7.796
-0.162
-2.03%
jan 1, 2002
7.385
-0.41
-5.26%
jan 1, 2003
6.983
-0.403
-5.45%
jan 1, 2004
7.334
+0.351
5.03%
jan 1, 2005
7.018
-0.316
-4.31%
jan 1, 2006
6.704
-0.313
-4.47%
jan 1, 2007
6.843
+0.139
2.07%
jan 1, 2008
5.901
-0.942
-13.76%
jan 1, 2009
4.899
-1.002
-16.98%
jan 1, 2010
4.746
-0.154
-3.14%
jan 1, 2011
5.352
+0.607
12.78%
jan 1, 2012
6.616
+1.264
23.62%
jan 1, 2013
5.611
-1.005
-15.19%
jan 1, 2014
7.299
+1.687
30.07%
jan 1, 2015
7.45
+0.151
2.07%
Ranking of countries by current statistics by years


Comments: