29
/
en
AIzaSyAYiBZKx7MnpbEhh9jyipgxe19OcubqV5w
April 1, 2024
117787
Czech Republic
CZE
true
2
1
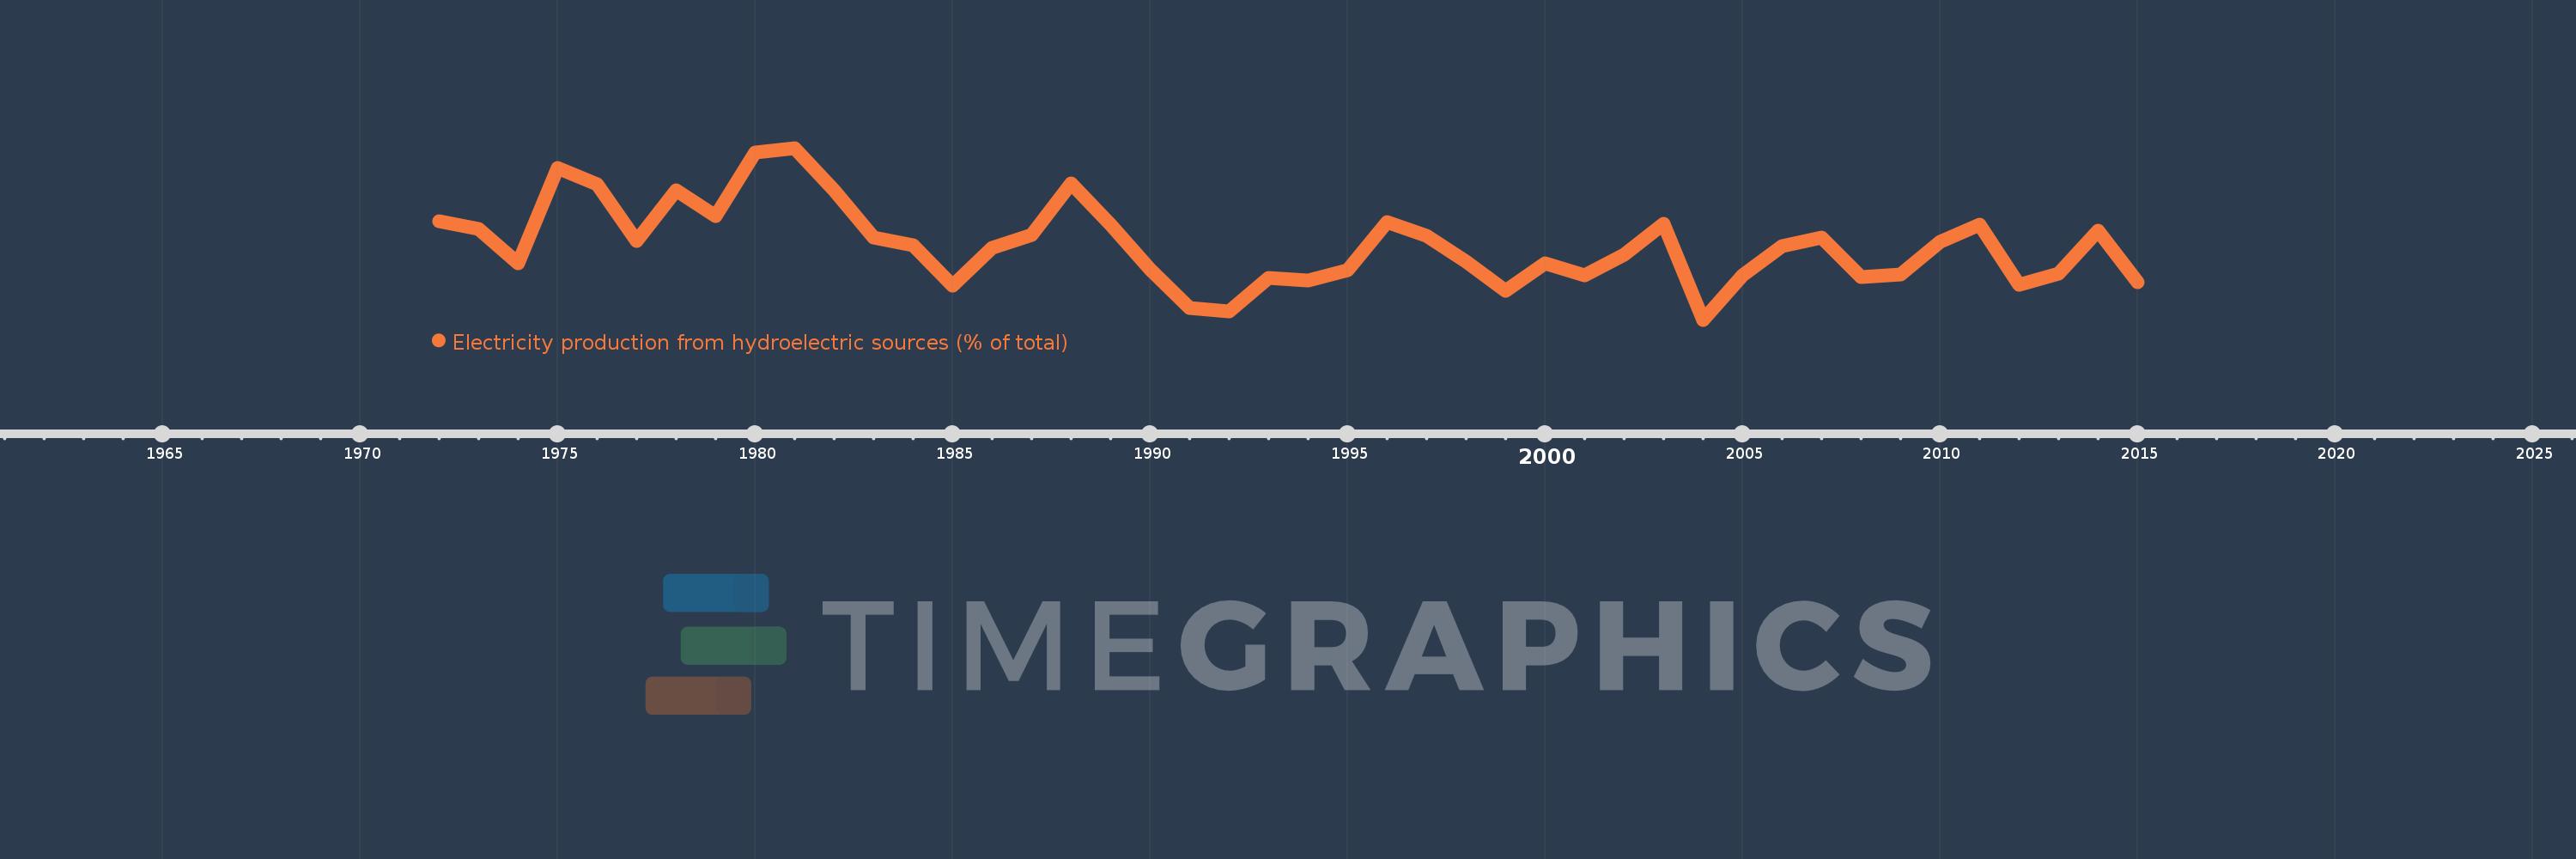
Electricity production from hydroelectric sources (% of total)
2015,2014,2013,2012,2011,2010,2009,2008,2007,2006,2005,2004,2003,2002,2001,2000,1999,1998,1997,1996,1995,1994,1993,1992,1991,1990,1989,1988,1987,1986,1985,1984,1983,1982,1981,1980,1979,1978,1977,1976,1975,1974,1973,1972
This statistics in other country:
AlbaniaAlgeriaAngolaArab WorldArgentinaArmeniaAustraliaAustriaAzerbaijanBahrainBangladeshBelarusBelgiumBeninBoliviaBosnia and HerzegovinaBotswanaBrazilBrunei DarussalamBulgariaCambodiaCameroonCanadaCentral Europe and the BalticsChileChinaColombiaCongo, Dem. Rep.Congo, Rep.Costa RicaCote d'IvoireCroatiaCubaCuracaoCyprusCzech RepublicDenmarkDominican RepublicEarly-demographic dividendEast Asia & PacificEast Asia & Pacific (excluding high income)East Asia & Pacific (IDA & IBRD countries)EcuadorEgypt, Arab Rep.El SalvadorEritreaEstoniaEthiopiaEuro areaEurope & Central AsiaEurope & Central Asia (excluding high income)Europe & Central Asia (IDA & IBRD countries)European UnionFinlandFragile and conflict affected situationsFranceGabonGeorgiaGermanyGhanaGibraltarGreeceGuatemalaHaitiHeavily indebted poor countries (HIPC)High incomeHondurasHong Kong SAR, ChinaHungaryIBRD onlyIcelandIDA & IBRD totalIDA blendIDA onlyIDA totalIndiaIndonesiaIran, Islamic Rep.IraqIrelandIsraelItalyJamaicaJapanJordanKazakhstanKenyaKorea, Dem. People’s Rep.Korea, Rep.KosovoKuwaitKyrgyz RepublicLate-demographic dividendLatin America & Caribbean Latin America & Caribbean (excluding high income)Latin America & the Caribbean (IDA & IBRD countries)LatviaLeast developed countries: UN classificationLebanonLibyaLithuaniaLow & middle incomeLower middle incomeLuxembourgMacedonia, FYRMalaysiaMaltaMauritiusMexicoMiddle East & North AfricaMiddle East & North Africa (excluding high income)Middle East & North Africa (IDA & IBRD countries)Middle incomeMoldovaMongoliaMontenegroMoroccoMozambiqueMyanmarNamibiaNepalNetherlandsNew ZealandNicaraguaNigerNigeriaNorth AmericaNorwayOECD membersOmanOther small statesPakistanPanamaParaguayPeruPhilippinesPolandPortugalPost-demographic dividendPre-demographic dividendQatarRomaniaRussian FederationSaudi ArabiaSenegalSerbiaSingaporeSlovak RepublicSloveniaSmall statesSouth AfricaSouth AsiaSouth Asia (IDA & IBRD)South SudanSpainSri LankaSub-Saharan Africa Sub-Saharan Africa (excluding high income)Sub-Saharan Africa (IDA & IBRD countries)SudanSwedenSwitzerlandSyrian Arab RepublicTajikistanTanzaniaThailandTogoTrinidad and TobagoTunisiaTurkeyTurkmenistanUkraineUnited Arab EmiratesUnited KingdomUnited StatesUpper middle incomeUruguayUzbekistanVenezuela, RBVietnamWorldYemen, Rep.ZambiaZimbabwe Timeline:
This timeline shows a graph from 1972 to 2015 of Czech Republic. No data until 1971. Number of actual observations by date: 44.
Source name:
World Development Indicators
Source organization:
IEA Statistics © OECD/IEA 2014 (http://www.iea.org/stats/index.asp), subject to https://www.iea.org/t&c/termsandconditions/
Categories, topics:
Energy & Mining, Climate Change, Infrastructure
Last updated:
apr 23, 2017
Indicators value changes by year
At the date of observation
Value
Absolute change
Change from previous value
jan 1, 1972
3.321
+3.321
0.0%
jan 1, 1973
3.194
-0.128
-3.84%
jan 1, 1974
2.625
-0.568
-17.79%
jan 1, 1975
4.217
+1.591
60.6%
jan 1, 1976
3.951
-0.265
-6.29%
jan 1, 1977
2.998
-0.953
-24.12%
jan 1, 1978
3.842
+0.844
28.15%
jan 1, 1979
3.41
-0.432
-11.25%
jan 1, 1980
4.474
+1.064
31.21%
jan 1, 1981
4.556
+0.082
1.83%
jan 1, 1982
3.847
-0.709
-15.57%
jan 1, 1983
3.056
-0.791
-20.56%
jan 1, 1984
2.921
-0.135
-4.4%
jan 1, 1985
2.237
-0.684
-23.43%
jan 1, 1986
2.875
+0.638
28.52%
jan 1, 1987
3.095
+0.22
7.66%
jan 1, 1988
3.963
+0.868
28.04%
jan 1, 1989
3.263
-0.701
-17.68%
jan 1, 1990
2.523
-0.74
-22.68%
jan 1, 1991
1.864
-0.658
-26.09%
jan 1, 1992
1.806
-0.058
-3.13%
jan 1, 1993
2.374
+0.568
31.45%
jan 1, 1994
2.334
-0.04
-1.68%
jan 1, 1995
2.5
+0.166
7.13%
jan 1, 1996
3.305
+0.805
32.17%
jan 1, 1997
3.085
-0.22
-6.65%
jan 1, 1998
2.646
-0.439
-14.24%
jan 1, 1999
2.16
-0.486
-18.35%
jan 1, 2000
2.62
+0.46
21.29%
jan 1, 2001
2.411
-0.209
-7.97%
jan 1, 2002
2.767
+0.356
14.76%
jan 1, 2003
3.279
+0.512
18.51%
jan 1, 2004
1.67
-1.609
-49.07%
jan 1, 2005
2.41
+0.74
44.29%
jan 1, 2006
2.905
+0.495
20.55%
jan 1, 2007
3.048
+0.143
4.94%
jan 1, 2008
2.38
-0.668
-21.91%
jan 1, 2009
2.434
+0.053
2.25%
jan 1, 2010
2.973
+0.539
22.17%
jan 1, 2011
3.269
+0.296
9.95%
jan 1, 2012
2.26
-1.009
-30.87%
jan 1, 2013
2.452
+0.192
8.48%
jan 1, 2014
3.173
+0.722
29.43%
jan 1, 2015
2.295
-0.878
-27.68%
Ranking of countries by current statistics by years


Comments: