29
/
en
AIzaSyAYiBZKx7MnpbEhh9jyipgxe19OcubqV5w
April 1, 2024
59700
Sub-Saharan Africa (excluding high income)
SSA
false
2
1
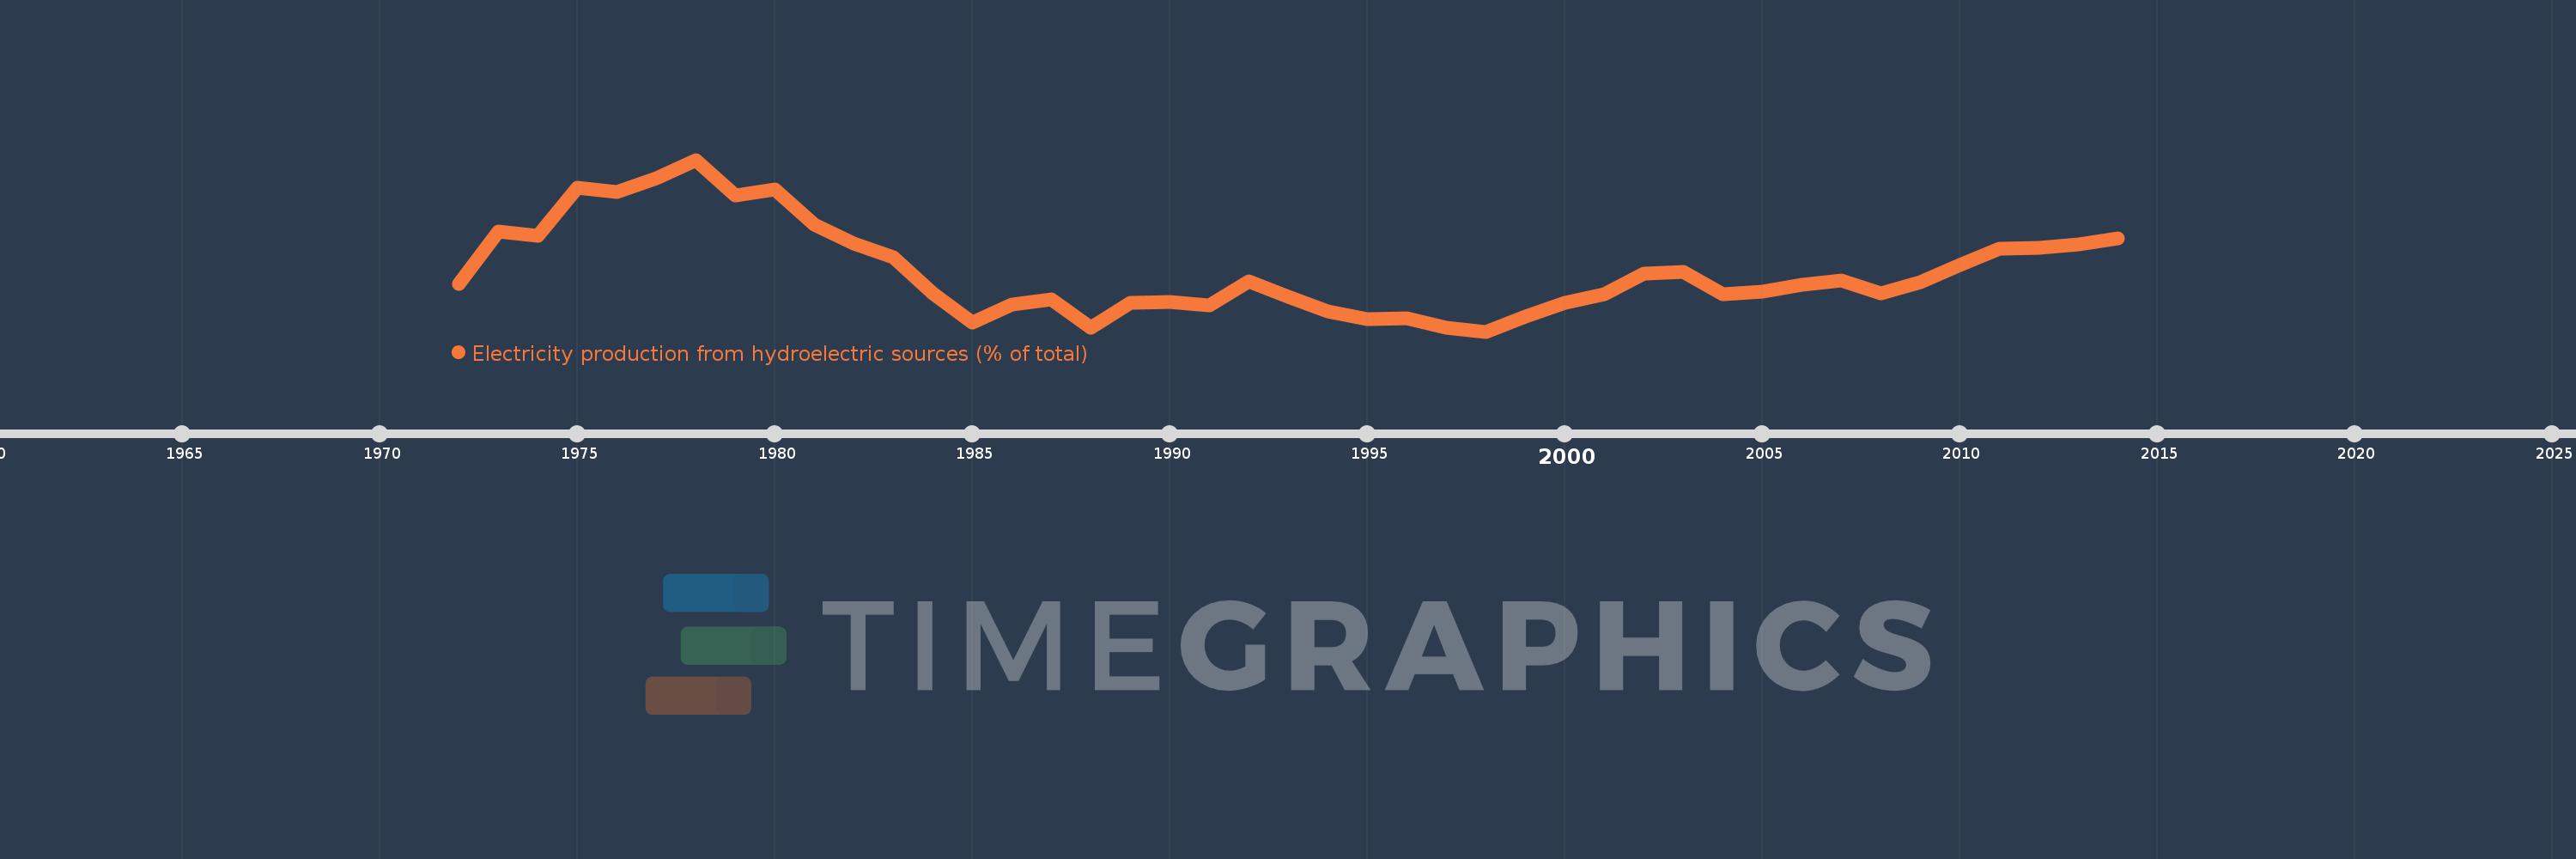
Electricity production from hydroelectric sources (% of total)
2014,2013,2012,2011,2010,2009,2008,2007,2006,2005,2004,2003,2002,2001,2000,1999,1998,1997,1996,1995,1994,1993,1992,1991,1990,1989,1988,1987,1986,1985,1984,1983,1982,1981,1980,1979,1978,1977,1976,1975,1974,1973,1972
This statistics in other country:
AlbaniaAlgeriaAngolaArab WorldArgentinaArmeniaAustraliaAustriaAzerbaijanBahrainBangladeshBelarusBelgiumBeninBoliviaBosnia and HerzegovinaBotswanaBrazilBrunei DarussalamBulgariaCambodiaCameroonCanadaCentral Europe and the BalticsChileChinaColombiaCongo, Dem. Rep.Congo, Rep.Costa RicaCote d'IvoireCroatiaCubaCuracaoCyprusCzech RepublicDenmarkDominican RepublicEarly-demographic dividendEast Asia & PacificEast Asia & Pacific (excluding high income)East Asia & Pacific (IDA & IBRD countries)EcuadorEgypt, Arab Rep.El SalvadorEritreaEstoniaEthiopiaEuro areaEurope & Central AsiaEurope & Central Asia (excluding high income)Europe & Central Asia (IDA & IBRD countries)European UnionFinlandFragile and conflict affected situationsFranceGabonGeorgiaGermanyGhanaGibraltarGreeceGuatemalaHaitiHeavily indebted poor countries (HIPC)High incomeHondurasHong Kong SAR, ChinaHungaryIBRD onlyIcelandIDA & IBRD totalIDA blendIDA onlyIDA totalIndiaIndonesiaIran, Islamic Rep.IraqIrelandIsraelItalyJamaicaJapanJordanKazakhstanKenyaKorea, Dem. People’s Rep.Korea, Rep.KosovoKuwaitKyrgyz RepublicLate-demographic dividendLatin America & Caribbean Latin America & Caribbean (excluding high income)Latin America & the Caribbean (IDA & IBRD countries)LatviaLeast developed countries: UN classificationLebanonLibyaLithuaniaLow & middle incomeLower middle incomeLuxembourgMacedonia, FYRMalaysiaMaltaMauritiusMexicoMiddle East & North AfricaMiddle East & North Africa (excluding high income)Middle East & North Africa (IDA & IBRD countries)Middle incomeMoldovaMongoliaMontenegroMoroccoMozambiqueMyanmarNamibiaNepalNetherlandsNew ZealandNicaraguaNigerNigeriaNorth AmericaNorwayOECD membersOmanOther small statesPakistanPanamaParaguayPeruPhilippinesPolandPortugalPost-demographic dividendPre-demographic dividendQatarRomaniaRussian FederationSaudi ArabiaSenegalSerbiaSingaporeSlovak RepublicSloveniaSmall statesSouth AfricaSouth AsiaSouth Asia (IDA & IBRD)South SudanSpainSri LankaSub-Saharan Africa Sub-Saharan Africa (excluding high income)Sub-Saharan Africa (IDA & IBRD countries)SudanSwedenSwitzerlandSyrian Arab RepublicTajikistanTanzaniaThailandTogoTrinidad and TobagoTunisiaTurkeyTurkmenistanUkraineUnited Arab EmiratesUnited KingdomUnited StatesUpper middle incomeUruguayUzbekistanVenezuela, RBVietnamWorldYemen, Rep.ZambiaZimbabwe Timeline:
This timeline shows a graph from 1972 to 2014 of Sub-Saharan Africa (excluding high income). No data until 1971. Number of actual observations by date: 43.
Source name:
World Development Indicators
Source organization:
IEA Statistics © OECD/IEA 2014 (http://www.iea.org/stats/index.asp), subject to https://www.iea.org/t&c/termsandconditions/
Categories, topics:
Energy & Mining, Climate Change, Infrastructure
Last updated:
apr 23, 2017
Indicators value changes by year
Minimum:
14.903
jan 1, 1998
Maximum:
25.214
jan 1, 1978
At the date of observation
Value
Absolute change
Change from previous value
jan 1, 1972
17.756
+17.756
0.0%
jan 1, 1973
20.922
+3.166
17.83%
jan 1, 1974
20.627
-0.295
-1.41%
jan 1, 1975
23.555
+2.927
14.19%
jan 1, 1976
23.289
-0.265
-1.13%
jan 1, 1977
24.083
+0.793
3.41%
jan 1, 1978
25.214
+1.131
4.7%
jan 1, 1979
23.083
-2.131
-8.45%
jan 1, 1980
23.421
+0.338
1.46%
jan 1, 1981
21.307
-2.114
-9.03%
jan 1, 1982
20.211
-1.096
-5.14%
jan 1, 1983
19.349
-0.862
-4.27%
jan 1, 1984
17.208
-2.141
-11.07%
jan 1, 1985
15.465
-1.742
-10.12%
jan 1, 1986
16.533
+1.068
6.9%
jan 1, 1987
16.811
+0.277
1.68%
jan 1, 1988
15.14
-1.671
-9.94%
jan 1, 1989
16.632
+1.493
9.86%
jan 1, 1990
16.7
+0.068
0.41%
jan 1, 1991
16.464
-0.236
-1.42%
jan 1, 1992
17.938
+1.475
8.96%
jan 1, 1993
17.01
-0.928
-5.17%
jan 1, 1994
16.11
-0.9
-5.29%
jan 1, 1995
15.634
-0.476
-2.95%
jan 1, 1996
15.722
+0.088
0.56%
jan 1, 1997
15.157
-0.565
-3.59%
jan 1, 1998
14.903
-0.254
-1.68%
jan 1, 1999
15.78
+0.877
5.89%
jan 1, 2000
16.606
+0.826
5.23%
jan 1, 2001
17.171
+0.565
3.4%
jan 1, 2002
18.376
+1.205
7.02%
jan 1, 2003
18.504
+0.128
0.7%
jan 1, 2004
17.136
-1.368
-7.39%
jan 1, 2005
17.297
+0.161
0.94%
jan 1, 2006
17.707
+0.41
2.37%
jan 1, 2007
17.976
+0.27
1.52%
jan 1, 2008
17.222
-0.755
-4.2%
jan 1, 2009
17.854
+0.632
3.67%
jan 1, 2010
18.894
+1.041
5.83%
jan 1, 2011
19.884
+0.99
5.24%
jan 1, 2012
19.948
+0.064
0.32%
jan 1, 2013
20.159
+0.211
1.06%
jan 1, 2014
20.475
+0.317
1.57%
Ranking of countries by current statistics by years


Comments: