29
/
en
AIzaSyAYiBZKx7MnpbEhh9jyipgxe19OcubqV5w
April 1, 2024
29766
Euro area
EMU
false
2
1
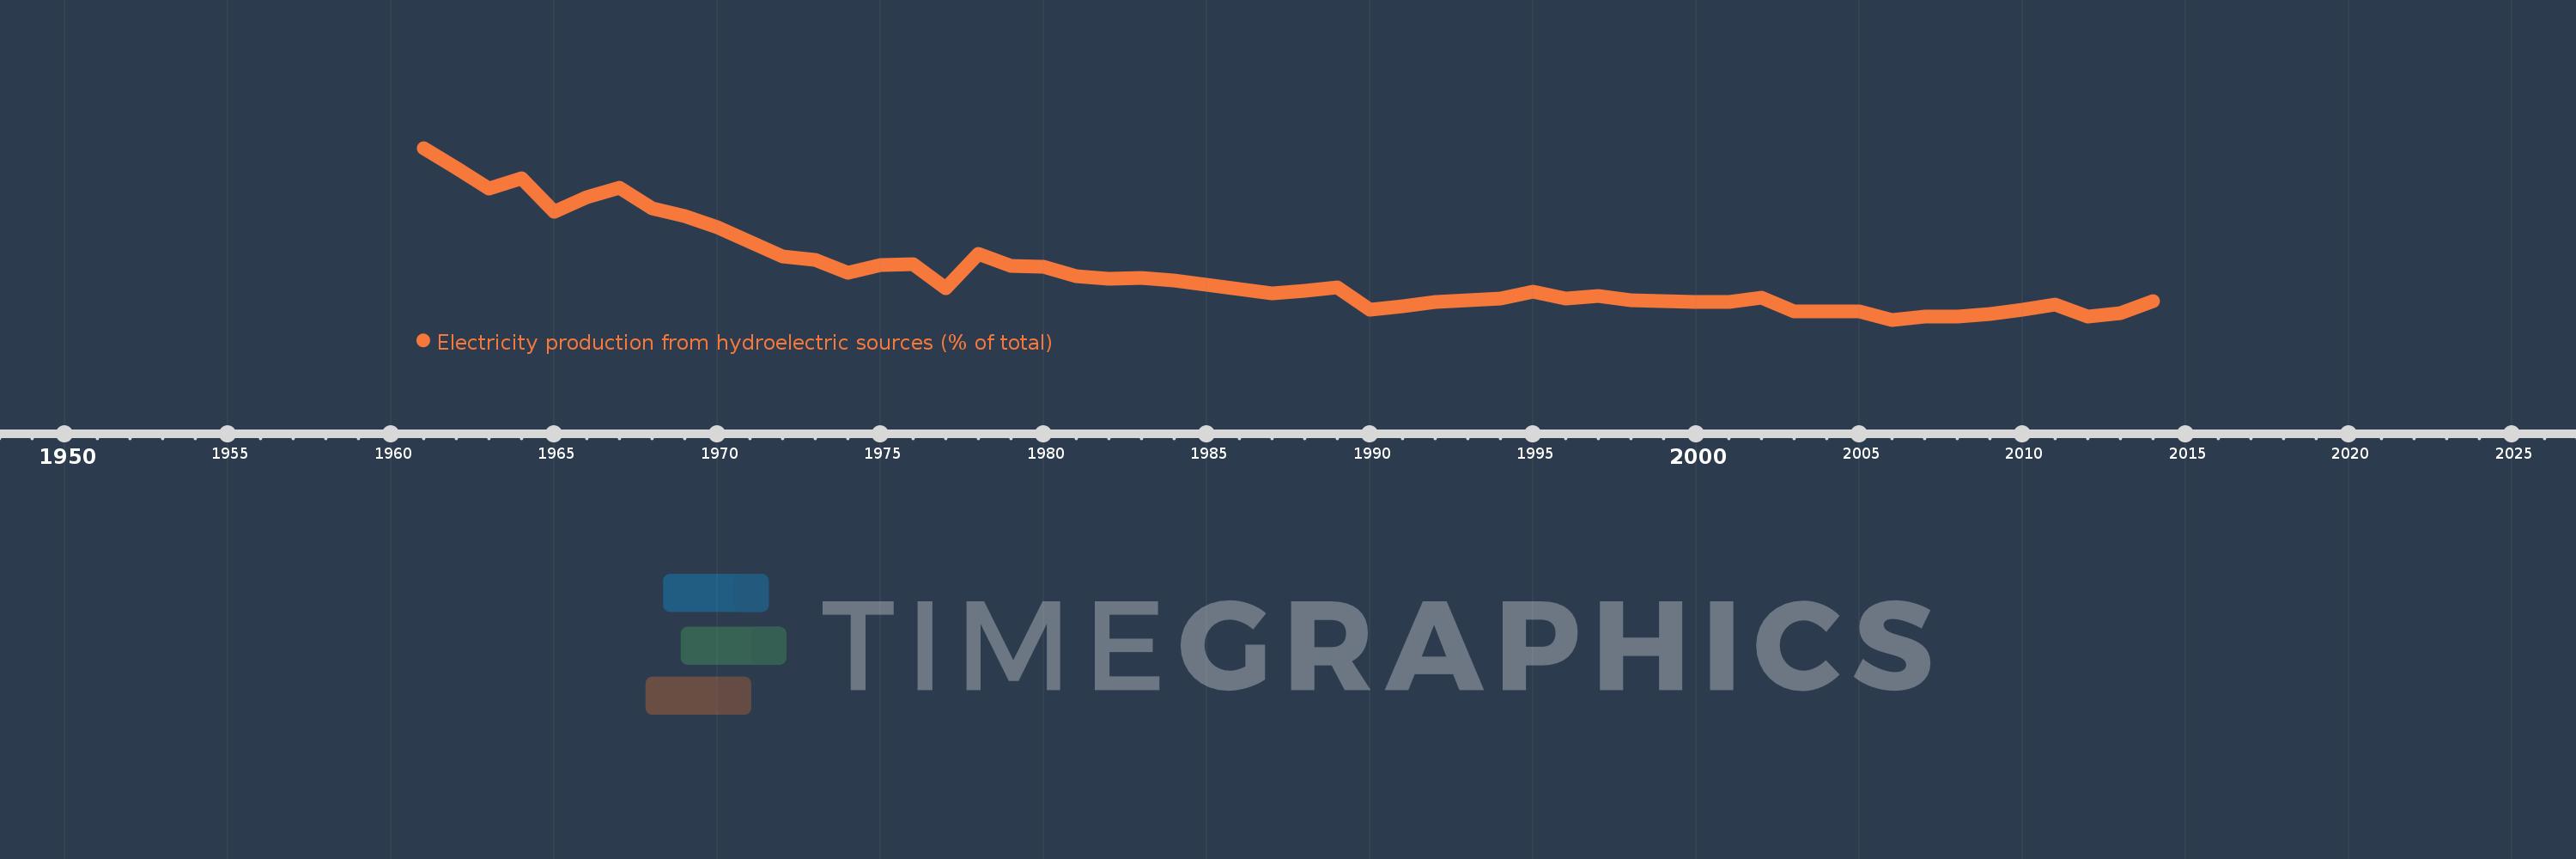
Electricity production from hydroelectric sources (% of total)
2014,2013,2012,2011,2010,2009,2008,2007,2006,2005,2004,2003,2002,2001,2000,1999,1998,1997,1996,1995,1994,1993,1992,1991,1990,1989,1988,1987,1986,1985,1984,1983,1982,1981,1980,1979,1978,1977,1976,1975,1974,1973,1972,1971,1970,1969,1968,1967,1966,1965,1964,1963,1962,1961
This statistics in other country:
AlbaniaAlgeriaAngolaArab WorldArgentinaArmeniaAustraliaAustriaAzerbaijanBahrainBangladeshBelarusBelgiumBeninBoliviaBosnia and HerzegovinaBotswanaBrazilBrunei DarussalamBulgariaCambodiaCameroonCanadaCentral Europe and the BalticsChileChinaColombiaCongo, Dem. Rep.Congo, Rep.Costa RicaCote d'IvoireCroatiaCubaCuracaoCyprusCzech RepublicDenmarkDominican RepublicEarly-demographic dividendEast Asia & PacificEast Asia & Pacific (excluding high income)East Asia & Pacific (IDA & IBRD countries)EcuadorEgypt, Arab Rep.El SalvadorEritreaEstoniaEthiopiaEuro areaEurope & Central AsiaEurope & Central Asia (excluding high income)Europe & Central Asia (IDA & IBRD countries)European UnionFinlandFragile and conflict affected situationsFranceGabonGeorgiaGermanyGhanaGibraltarGreeceGuatemalaHaitiHeavily indebted poor countries (HIPC)High incomeHondurasHong Kong SAR, ChinaHungaryIBRD onlyIcelandIDA & IBRD totalIDA blendIDA onlyIDA totalIndiaIndonesiaIran, Islamic Rep.IraqIrelandIsraelItalyJamaicaJapanJordanKazakhstanKenyaKorea, Dem. People’s Rep.Korea, Rep.KosovoKuwaitKyrgyz RepublicLate-demographic dividendLatin America & Caribbean Latin America & Caribbean (excluding high income)Latin America & the Caribbean (IDA & IBRD countries)LatviaLeast developed countries: UN classificationLebanonLibyaLithuaniaLow & middle incomeLower middle incomeLuxembourgMacedonia, FYRMalaysiaMaltaMauritiusMexicoMiddle East & North AfricaMiddle East & North Africa (excluding high income)Middle East & North Africa (IDA & IBRD countries)Middle incomeMoldovaMongoliaMontenegroMoroccoMozambiqueMyanmarNamibiaNepalNetherlandsNew ZealandNicaraguaNigerNigeriaNorth AmericaNorwayOECD membersOmanOther small statesPakistanPanamaParaguayPeruPhilippinesPolandPortugalPost-demographic dividendPre-demographic dividendQatarRomaniaRussian FederationSaudi ArabiaSenegalSerbiaSingaporeSlovak RepublicSloveniaSmall statesSouth AfricaSouth AsiaSouth Asia (IDA & IBRD)South SudanSpainSri LankaSub-Saharan Africa Sub-Saharan Africa (excluding high income)Sub-Saharan Africa (IDA & IBRD countries)SudanSwedenSwitzerlandSyrian Arab RepublicTajikistanTanzaniaThailandTogoTrinidad and TobagoTunisiaTurkeyTurkmenistanUkraineUnited Arab EmiratesUnited KingdomUnited StatesUpper middle incomeUruguayUzbekistanVenezuela, RBVietnamWorldYemen, Rep.ZambiaZimbabwe Timeline:
This timeline shows a graph from 1961 to 2014 of Euro area. No data until 1960. Number of actual observations by date: 54.
Source name:
World Development Indicators
Source organization:
IEA Statistics © OECD/IEA 2014 (http://www.iea.org/stats/index.asp), subject to https://www.iea.org/t&c/termsandconditions/
Categories, topics:
Energy & Mining, Climate Change, Infrastructure
Last updated:
apr 23, 2017
Indicators value changes by year
Maximum:
38.726
jan 1, 1961
At the date of observation
Value
Absolute change
Change from previous value
jan 1, 1961
38.726
+38.726
0.0%
jan 1, 1962
35.16
-3.566
-9.21%
jan 1, 1963
31.542
-3.618
-10.29%
jan 1, 1964
33.362
+1.819
5.77%
jan 1, 1965
27.566
-5.795
-17.37%
jan 1, 1966
30.039
+2.473
8.97%
jan 1, 1967
31.794
+1.754
5.84%
jan 1, 1968
28.104
-3.69
-11.61%
jan 1, 1969
26.846
-1.258
-4.48%
jan 1, 1970
24.822
-2.024
-7.54%
jan 1, 1971
22.265
-2.558
-10.3%
jan 1, 1972
19.707
-2.558
-11.49%
jan 1, 1973
19.045
-0.661
-3.36%
jan 1, 1974
16.85
-2.195
-11.53%
jan 1, 1975
18.142
+1.292
7.66%
jan 1, 1976
18.345
+0.203
1.12%
jan 1, 1977
14.12
-4.225
-23.03%
jan 1, 1978
20.179
+6.059
42.91%
jan 1, 1979
18.04
-2.139
-10.6%
jan 1, 1980
17.898
-0.143
-0.79%
jan 1, 1981
16.246
-1.651
-9.23%
jan 1, 1982
15.808
-0.438
-2.7%
jan 1, 1983
15.881
+0.072
0.46%
jan 1, 1984
15.421
-0.46
-2.9%
jan 1, 1985
14.771
-0.65
-4.21%
jan 1, 1986
13.905
-0.865
-5.86%
jan 1, 1987
13.242
-0.664
-4.77%
jan 1, 1988
13.738
+0.496
3.75%
jan 1, 1989
14.343
+0.606
4.41%
jan 1, 1990
10.3
-4.044
-28.19%
jan 1, 1991
11.025
+0.726
7.05%
jan 1, 1992
11.679
+0.654
5.93%
jan 1, 1993
11.97
+0.291
2.49%
jan 1, 1994
12.394
+0.424
3.54%
jan 1, 1995
13.531
+1.137
9.18%
jan 1, 1996
12.363
-1.168
-8.63%
jan 1, 1997
12.8
+0.437
3.54%
jan 1, 1998
12.067
-0.733
-5.73%
jan 1, 1999
11.943
-0.124
-1.03%
jan 1, 2000
11.778
-0.165
-1.38%
jan 1, 2001
11.706
-0.072
-0.61%
jan 1, 2002
12.486
+0.779
6.66%
jan 1, 2003
10.056
-2.429
-19.46%
jan 1, 2004
10.106
+0.05
0.5%
jan 1, 2005
10.08
-0.026
-0.26%
jan 1, 2006
8.601
-1.479
-14.67%
jan 1, 2007
9.177
+0.576
6.7%
jan 1, 2008
9.09
-0.087
-0.95%
jan 1, 2009
9.559
+0.469
5.16%
jan 1, 2010
10.307
+0.748
7.82%
jan 1, 2011
11.278
+0.971
9.42%
jan 1, 2012
9.218
-2.06
-18.26%
jan 1, 2013
9.835
+0.617
6.69%
jan 1, 2014
11.877
+2.042
20.76%
Ranking of countries by current statistics by years


Comments: