29
/
en
AIzaSyAYiBZKx7MnpbEhh9jyipgxe19OcubqV5w
April 1, 2024
262118
Thailand
THA
true
2
1
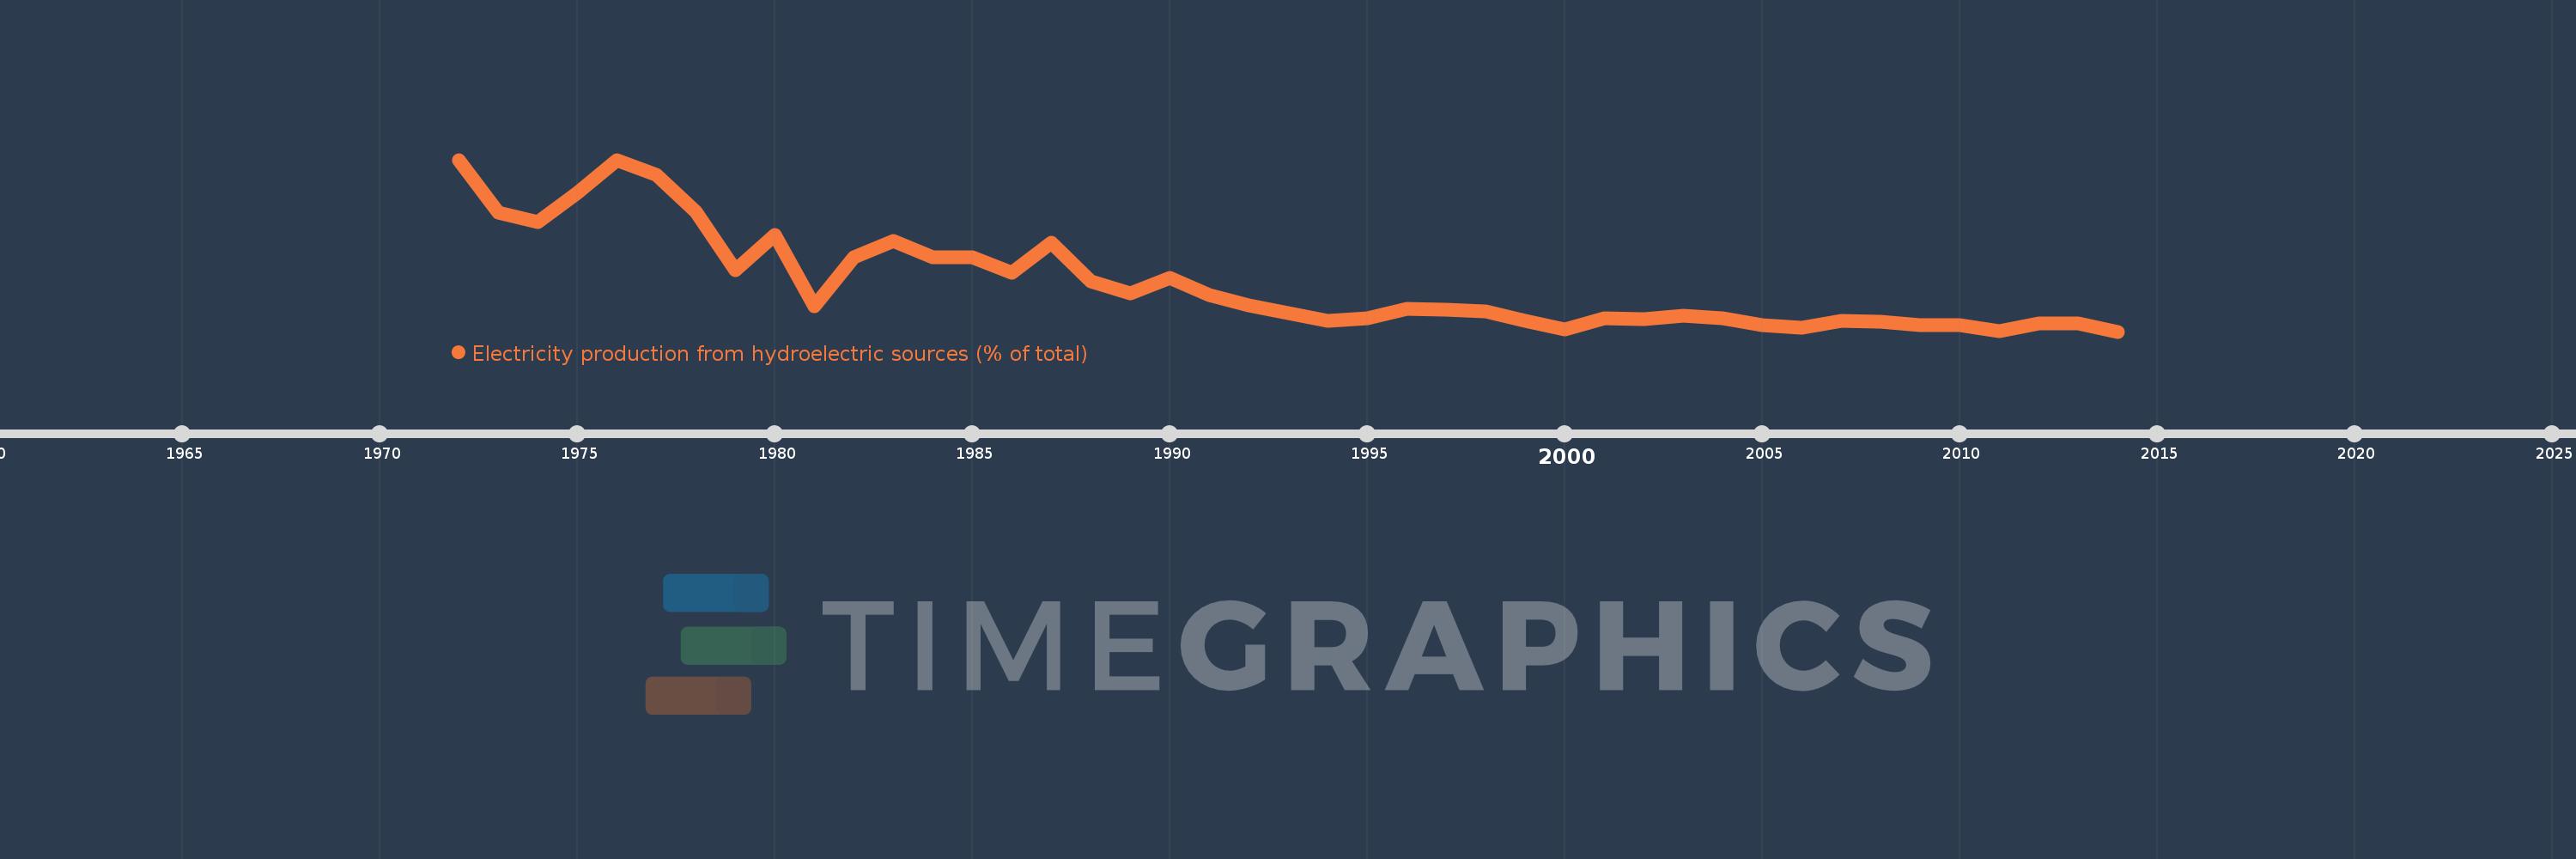
Electricity production from hydroelectric sources (% of total)
2014,2013,2012,2011,2010,2009,2008,2007,2006,2005,2004,2003,2002,2001,2000,1999,1998,1997,1996,1995,1994,1993,1992,1991,1990,1989,1988,1987,1986,1985,1984,1983,1982,1981,1980,1979,1978,1977,1976,1975,1974,1973,1972
This statistics in other country:
AlbaniaAlgeriaAngolaArab WorldArgentinaArmeniaAustraliaAustriaAzerbaijanBahrainBangladeshBelarusBelgiumBeninBoliviaBosnia and HerzegovinaBotswanaBrazilBrunei DarussalamBulgariaCambodiaCameroonCanadaCentral Europe and the BalticsChileChinaColombiaCongo, Dem. Rep.Congo, Rep.Costa RicaCote d'IvoireCroatiaCubaCuracaoCyprusCzech RepublicDenmarkDominican RepublicEarly-demographic dividendEast Asia & PacificEast Asia & Pacific (excluding high income)East Asia & Pacific (IDA & IBRD countries)EcuadorEgypt, Arab Rep.El SalvadorEritreaEstoniaEthiopiaEuro areaEurope & Central AsiaEurope & Central Asia (excluding high income)Europe & Central Asia (IDA & IBRD countries)European UnionFinlandFragile and conflict affected situationsFranceGabonGeorgiaGermanyGhanaGibraltarGreeceGuatemalaHaitiHeavily indebted poor countries (HIPC)High incomeHondurasHong Kong SAR, ChinaHungaryIBRD onlyIcelandIDA & IBRD totalIDA blendIDA onlyIDA totalIndiaIndonesiaIran, Islamic Rep.IraqIrelandIsraelItalyJamaicaJapanJordanKazakhstanKenyaKorea, Dem. People’s Rep.Korea, Rep.KosovoKuwaitKyrgyz RepublicLate-demographic dividendLatin America & Caribbean Latin America & Caribbean (excluding high income)Latin America & the Caribbean (IDA & IBRD countries)LatviaLeast developed countries: UN classificationLebanonLibyaLithuaniaLow & middle incomeLower middle incomeLuxembourgMacedonia, FYRMalaysiaMaltaMauritiusMexicoMiddle East & North AfricaMiddle East & North Africa (excluding high income)Middle East & North Africa (IDA & IBRD countries)Middle incomeMoldovaMongoliaMontenegroMoroccoMozambiqueMyanmarNamibiaNepalNetherlandsNew ZealandNicaraguaNigerNigeriaNorth AmericaNorwayOECD membersOmanOther small statesPakistanPanamaParaguayPeruPhilippinesPolandPortugalPost-demographic dividendPre-demographic dividendQatarRomaniaRussian FederationSaudi ArabiaSenegalSerbiaSingaporeSlovak RepublicSloveniaSmall statesSouth AfricaSouth AsiaSouth Asia (IDA & IBRD)South SudanSpainSri LankaSub-Saharan Africa Sub-Saharan Africa (excluding high income)Sub-Saharan Africa (IDA & IBRD countries)SudanSwedenSwitzerlandSyrian Arab RepublicTajikistanTanzaniaThailandTogoTrinidad and TobagoTunisiaTurkeyTurkmenistanUkraineUnited Arab EmiratesUnited KingdomUnited StatesUpper middle incomeUruguayUzbekistanVenezuela, RBVietnamWorldYemen, Rep.ZambiaZimbabwe Timeline:
This timeline shows a graph from 1972 to 2014 of Thailand. No data until 1971. Number of actual observations by date: 43.
Source name:
World Development Indicators
Source organization:
IEA Statistics © OECD/IEA 2014 (http://www.iea.org/stats/index.asp), subject to https://www.iea.org/t&c/termsandconditions/
Categories, topics:
Energy & Mining, Climate Change, Infrastructure
Last updated:
apr 23, 2017
Indicators value changes by year
Maximum:
40.291
jan 1, 1972
At the date of observation
Value
Absolute change
Change from previous value
jan 1, 1972
40.291
+40.291
0.0%
jan 1, 1973
28.921
-11.371
-28.22%
jan 1, 1974
26.969
-1.952
-6.75%
jan 1, 1975
33.239
+6.27
23.25%
jan 1, 1976
40.273
+7.034
21.16%
jan 1, 1977
37.014
-3.258
-8.09%
jan 1, 1978
29.217
-7.797
-21.07%
jan 1, 1979
16.697
-12.52
-42.85%
jan 1, 1980
24.273
+7.576
45.37%
jan 1, 1981
8.824
-15.449
-63.65%
jan 1, 1982
19.351
+10.526
119.29%
jan 1, 1983
22.978
+3.628
18.75%
jan 1, 1984
19.41
-3.568
-15.53%
jan 1, 1985
19.411
+0.001
0.0%
jan 1, 1986
15.996
-3.415
-17.59%
jan 1, 1987
22.47
+6.474
40.47%
jan 1, 1988
14.222
-8.248
-36.71%
jan 1, 1989
11.638
-2.585
-18.17%
jan 1, 1990
14.891
+3.253
27.95%
jan 1, 1991
11.262
-3.629
-24.37%
jan 1, 1992
9.138
-2.124
-18.86%
jan 1, 1993
7.422
-1.716
-18.78%
jan 1, 1994
5.838
-1.584
-21.34%
jan 1, 1995
6.342
+0.503
8.62%
jan 1, 1996
8.381
+2.039
32.16%
jan 1, 1997
8.17
-0.211
-2.52%
jan 1, 1998
7.723
-0.447
-5.47%
jan 1, 1999
5.749
-1.974
-25.56%
jan 1, 2000
3.925
-1.824
-31.73%
jan 1, 2001
6.279
+2.354
59.97%
jan 1, 2002
6.154
-0.125
-1.98%
jan 1, 2003
6.853
+0.699
11.36%
jan 1, 2004
6.239
-0.614
-8.96%
jan 1, 2005
4.804
-1.435
-23.0%
jan 1, 2006
4.386
-0.418
-8.7%
jan 1, 2007
5.856
+1.47
33.52%
jan 1, 2008
5.659
-0.197
-3.36%
jan 1, 2009
4.825
-0.834
-14.74%
jan 1, 2010
4.817
-0.008
-0.16%
jan 1, 2011
3.471
-1.346
-27.94%
jan 1, 2012
5.233
+1.762
50.76%
jan 1, 2013
5.247
+0.014
0.26%
jan 1, 2014
3.469
-1.778
-33.89%
Ranking of countries by current statistics by years


Comments: