29
/
en
AIzaSyAYiBZKx7MnpbEhh9jyipgxe19OcubqV5w
April 1, 2024
276542
United States
USA
true
2
1
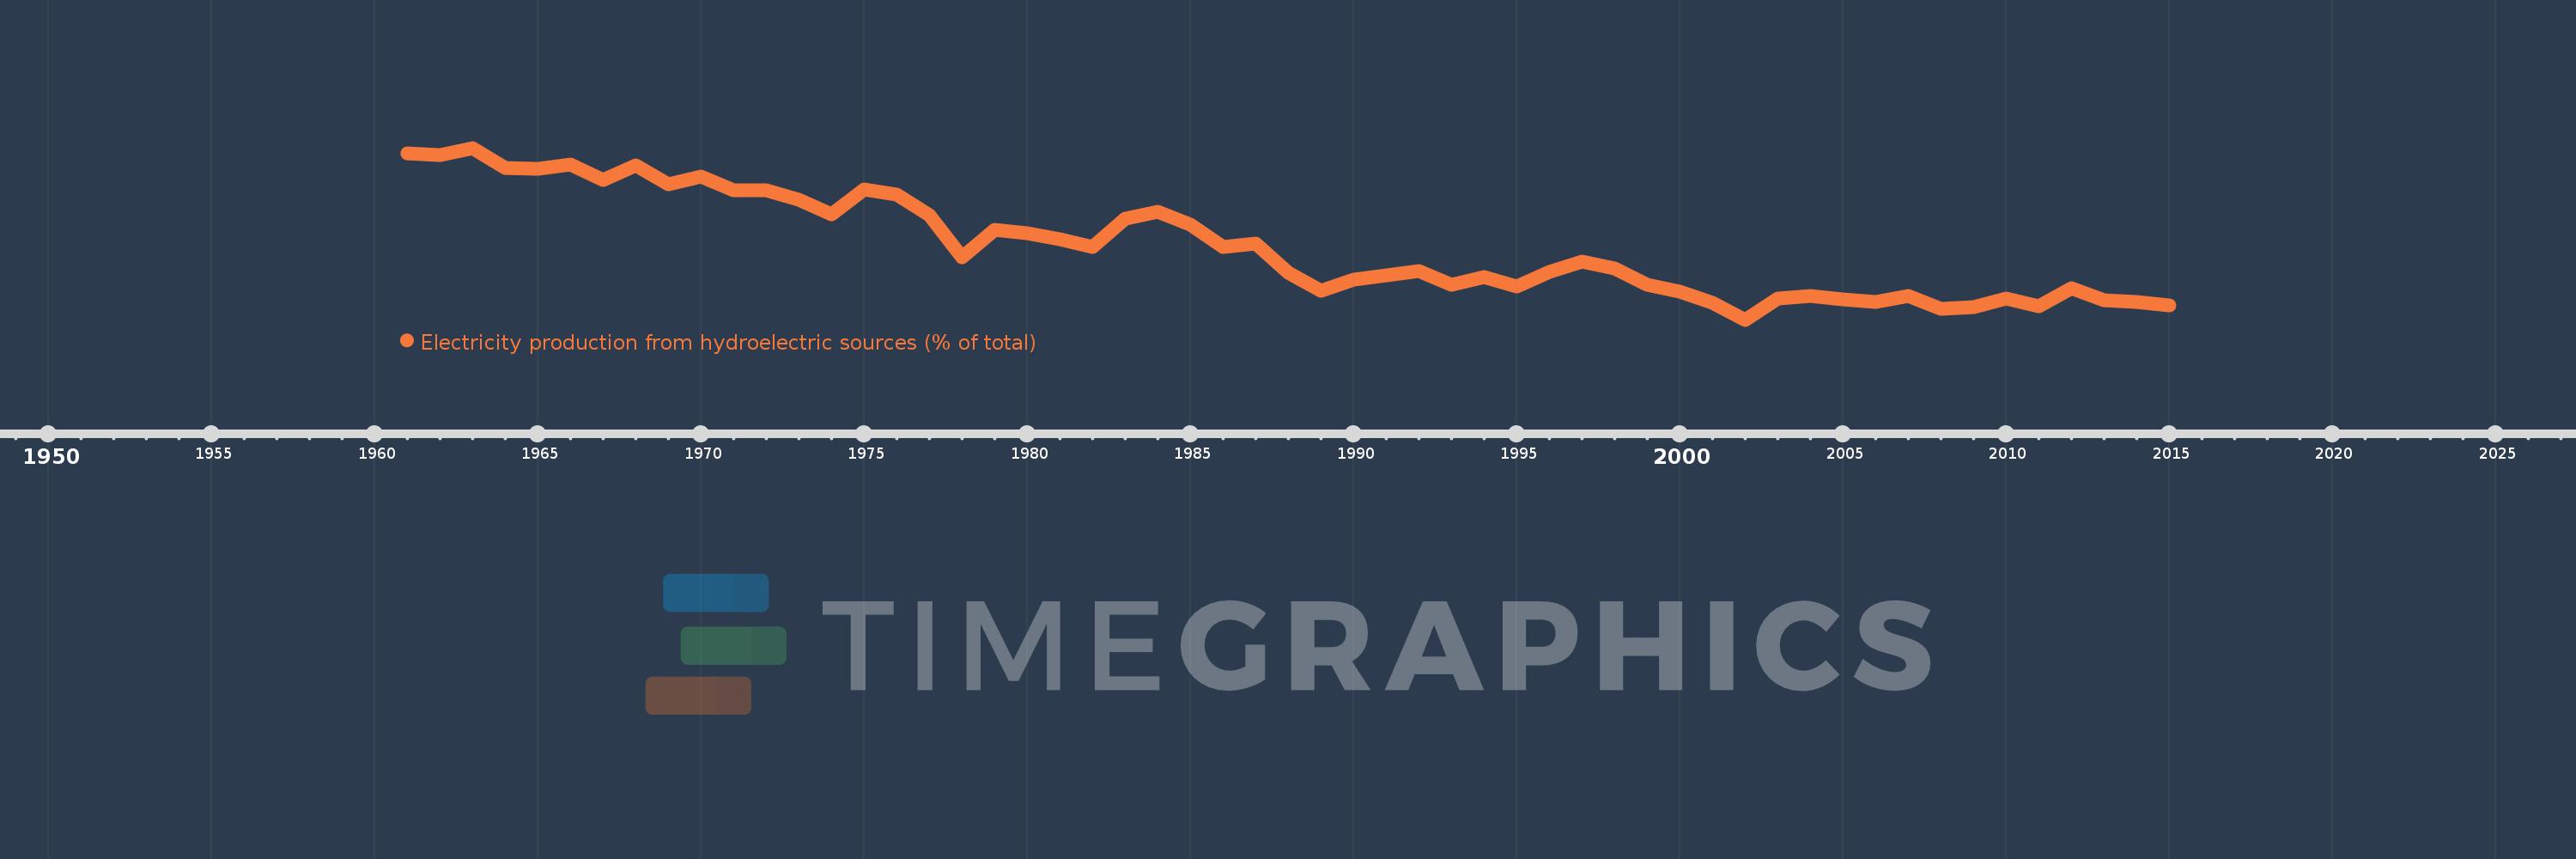
Electricity production from hydroelectric sources (% of total)
2015,2014,2013,2012,2011,2010,2009,2008,2007,2006,2005,2004,2003,2002,2001,2000,1999,1998,1997,1996,1995,1994,1993,1992,1991,1990,1989,1988,1987,1986,1985,1984,1983,1982,1981,1980,1979,1978,1977,1976,1975,1974,1973,1972,1971,1970,1969,1968,1967,1966,1965,1964,1963,1962,1961
This statistics in other country:
AlbaniaAlgeriaAngolaArab WorldArgentinaArmeniaAustraliaAustriaAzerbaijanBahrainBangladeshBelarusBelgiumBeninBoliviaBosnia and HerzegovinaBotswanaBrazilBrunei DarussalamBulgariaCambodiaCameroonCanadaCentral Europe and the BalticsChileChinaColombiaCongo, Dem. Rep.Congo, Rep.Costa RicaCote d'IvoireCroatiaCubaCuracaoCyprusCzech RepublicDenmarkDominican RepublicEarly-demographic dividendEast Asia & PacificEast Asia & Pacific (excluding high income)East Asia & Pacific (IDA & IBRD countries)EcuadorEgypt, Arab Rep.El SalvadorEritreaEstoniaEthiopiaEuro areaEurope & Central AsiaEurope & Central Asia (excluding high income)Europe & Central Asia (IDA & IBRD countries)European UnionFinlandFragile and conflict affected situationsFranceGabonGeorgiaGermanyGhanaGibraltarGreeceGuatemalaHaitiHeavily indebted poor countries (HIPC)High incomeHondurasHong Kong SAR, ChinaHungaryIBRD onlyIcelandIDA & IBRD totalIDA blendIDA onlyIDA totalIndiaIndonesiaIran, Islamic Rep.IraqIrelandIsraelItalyJamaicaJapanJordanKazakhstanKenyaKorea, Dem. People’s Rep.Korea, Rep.KosovoKuwaitKyrgyz RepublicLate-demographic dividendLatin America & Caribbean Latin America & Caribbean (excluding high income)Latin America & the Caribbean (IDA & IBRD countries)LatviaLeast developed countries: UN classificationLebanonLibyaLithuaniaLow & middle incomeLower middle incomeLuxembourgMacedonia, FYRMalaysiaMaltaMauritiusMexicoMiddle East & North AfricaMiddle East & North Africa (excluding high income)Middle East & North Africa (IDA & IBRD countries)Middle incomeMoldovaMongoliaMontenegroMoroccoMozambiqueMyanmarNamibiaNepalNetherlandsNew ZealandNicaraguaNigerNigeriaNorth AmericaNorwayOECD membersOmanOther small statesPakistanPanamaParaguayPeruPhilippinesPolandPortugalPost-demographic dividendPre-demographic dividendQatarRomaniaRussian FederationSaudi ArabiaSenegalSerbiaSingaporeSlovak RepublicSloveniaSmall statesSouth AfricaSouth AsiaSouth Asia (IDA & IBRD)South SudanSpainSri LankaSub-Saharan Africa Sub-Saharan Africa (excluding high income)Sub-Saharan Africa (IDA & IBRD countries)SudanSwedenSwitzerlandSyrian Arab RepublicTajikistanTanzaniaThailandTogoTrinidad and TobagoTunisiaTurkeyTurkmenistanUkraineUnited Arab EmiratesUnited KingdomUnited StatesUpper middle incomeUruguayUzbekistanVenezuela, RBVietnamWorldYemen, Rep.ZambiaZimbabwe Timeline:
This timeline shows a graph from 1961 to 2015 of United States. No data until 1960. Number of actual observations by date: 55.
Source name:
World Development Indicators
Source organization:
IEA Statistics © OECD/IEA 2014 (http://www.iea.org/stats/index.asp), subject to https://www.iea.org/t&c/termsandconditions/
Categories, topics:
Energy & Mining, Climate Change, Infrastructure
Last updated:
apr 23, 2017
Indicators value changes by year
Maximum:
18.881
jan 1, 1963
At the date of observation
Value
Absolute change
Change from previous value
jan 1, 1961
18.44
+18.44
0.0%
jan 1, 1962
18.271
-0.169
-0.91%
jan 1, 1963
18.881
+0.61
3.34%
jan 1, 1964
17.255
-1.625
-8.61%
jan 1, 1965
17.16
-0.095
-0.55%
jan 1, 1966
17.524
+0.364
2.12%
jan 1, 1967
16.249
-1.275
-7.28%
jan 1, 1968
17.448
+1.199
7.38%
jan 1, 1969
15.929
-1.519
-8.7%
jan 1, 1970
16.531
+0.602
3.78%
jan 1, 1971
15.425
-1.106
-6.69%
jan 1, 1972
15.469
+0.044
0.29%
jan 1, 1973
14.639
-0.83
-5.36%
jan 1, 1974
13.502
-1.137
-7.77%
jan 1, 1975
15.535
+2.033
15.06%
jan 1, 1976
15.07
-0.465
-3.0%
jan 1, 1977
13.403
-1.667
-11.06%
jan 1, 1978
9.973
-3.43
-25.59%
jan 1, 1979
12.227
+2.254
22.6%
jan 1, 1980
11.975
-0.251
-2.05%
jan 1, 1981
11.485
-0.49
-4.09%
jan 1, 1982
10.804
-0.681
-5.93%
jan 1, 1983
13.141
+2.337
21.63%
jan 1, 1984
13.697
+0.557
4.24%
jan 1, 1985
12.657
-1.041
-7.6%
jan 1, 1986
10.83
-1.826
-14.43%
jan 1, 1987
11.128
+0.298
2.75%
jan 1, 1988
8.717
-2.412
-21.67%
jan 1, 1989
7.292
-1.424
-16.34%
jan 1, 1990
8.19
+0.897
12.31%
jan 1, 1991
8.529
+0.339
4.14%
jan 1, 1992
8.855
+0.326
3.82%
jan 1, 1993
7.778
-1.077
-12.16%
jan 1, 1994
8.353
+0.576
7.4%
jan 1, 1995
7.612
-0.741
-8.87%
jan 1, 1996
8.828
+1.215
15.96%
jan 1, 1997
9.611
+0.784
8.88%
jan 1, 1998
9.073
-0.538
-5.6%
jan 1, 1999
7.783
-1.29
-14.22%
jan 1, 2000
7.174
-0.608
-7.82%
jan 1, 2001
6.289
-0.885
-12.34%
jan 1, 2002
4.904
-1.386
-22.03%
jan 1, 2003
6.632
+1.728
35.24%
jan 1, 2004
6.871
+0.239
3.61%
jan 1, 2005
6.536
-0.335
-4.88%
jan 1, 2006
6.382
-0.154
-2.35%
jan 1, 2007
6.827
+0.445
6.98%
jan 1, 2008
5.773
-1.054
-15.44%
jan 1, 2009
5.911
+0.138
2.39%
jan 1, 2010
6.616
+0.705
11.93%
jan 1, 2011
6.023
-0.593
-8.96%
jan 1, 2012
7.436
+1.413
23.46%
jan 1, 2013
6.521
-0.915
-12.3%
jan 1, 2014
6.318
-0.203
-3.11%
jan 1, 2015
6.052
-0.266
-4.21%
Ranking of countries by current statistics by years


Comments: