29
/
en
AIzaSyAYiBZKx7MnpbEhh9jyipgxe19OcubqV5w
April 1, 2024
204039
Myanmar
MMR
true
2
1
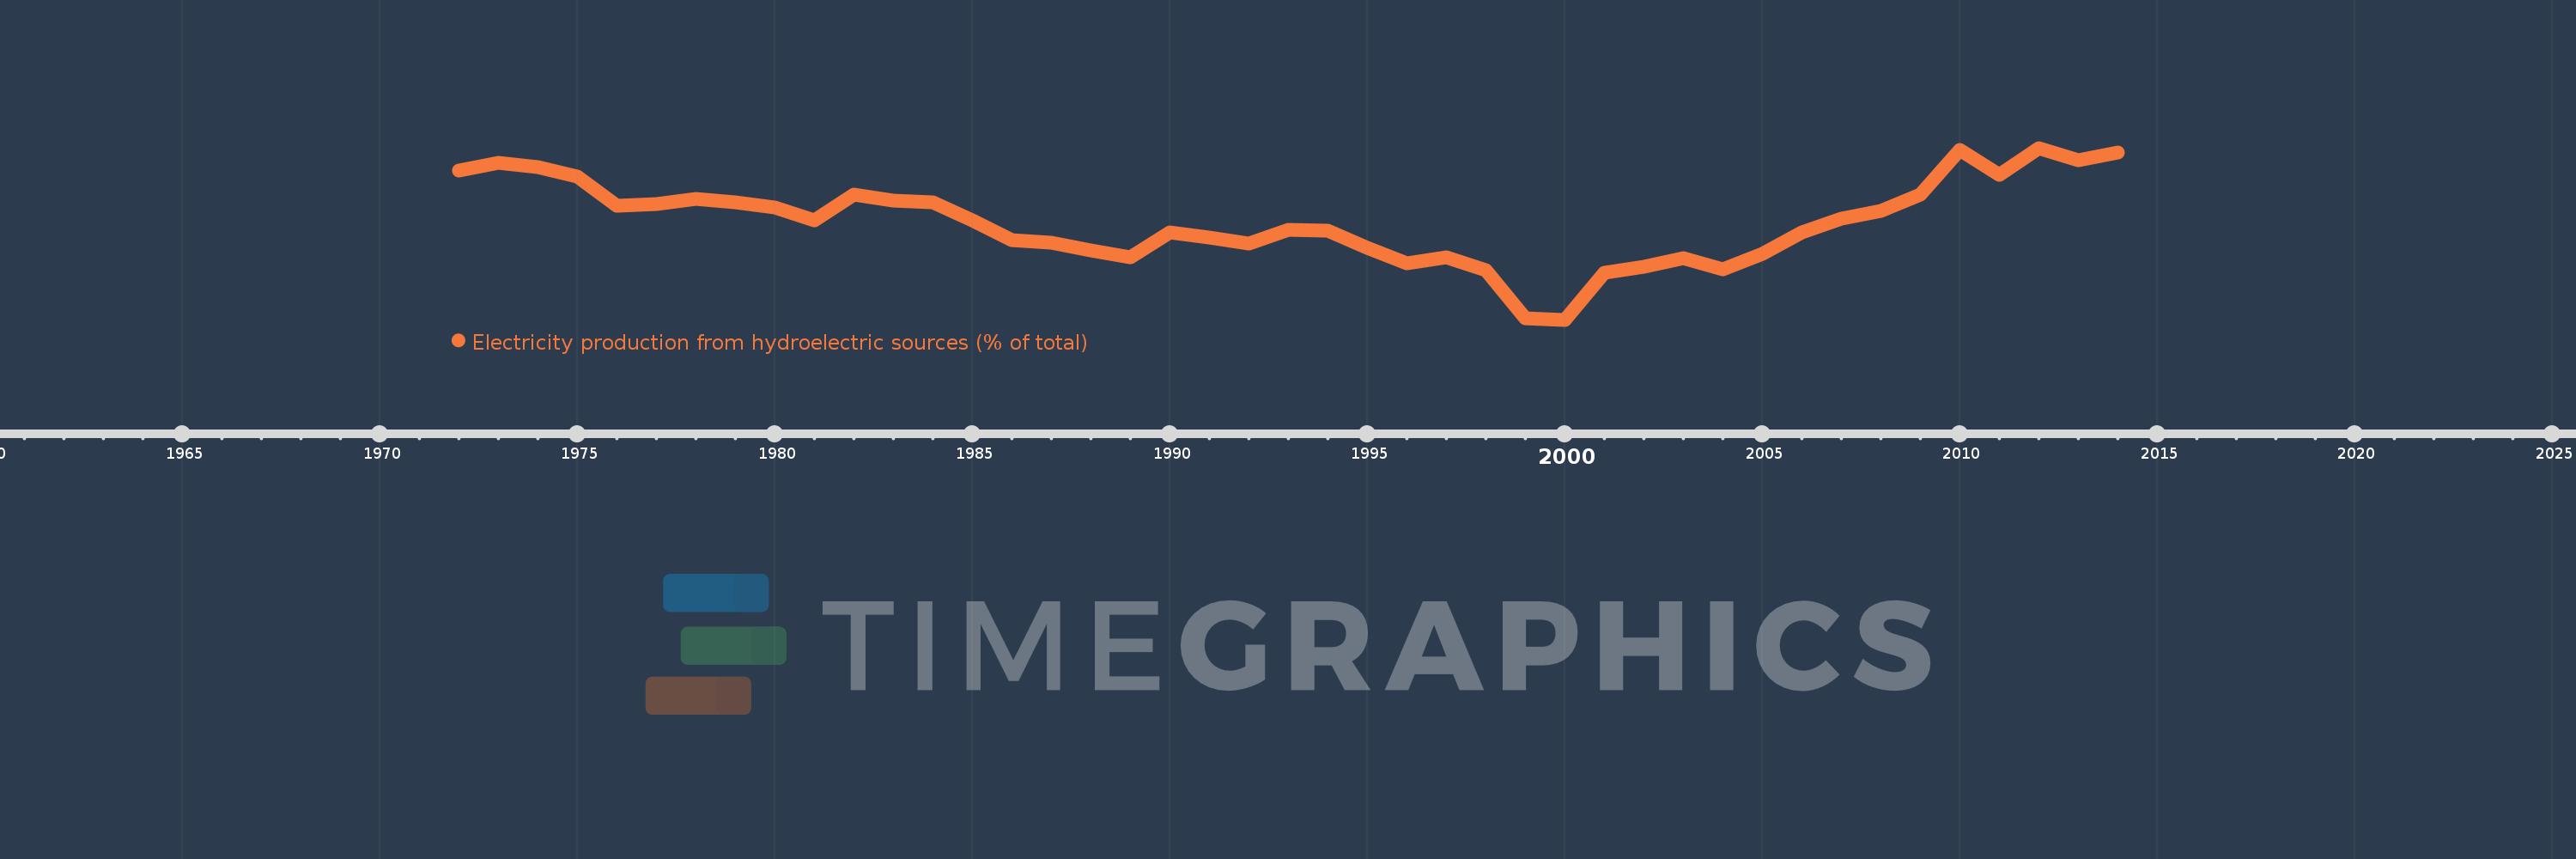
Electricity production from hydroelectric sources (% of total)
2014,2013,2012,2011,2010,2009,2008,2007,2006,2005,2004,2003,2002,2001,2000,1999,1998,1997,1996,1995,1994,1993,1992,1991,1990,1989,1988,1987,1986,1985,1984,1983,1982,1981,1980,1979,1978,1977,1976,1975,1974,1973,1972
This statistics in other country:
AlbaniaAlgeriaAngolaArab WorldArgentinaArmeniaAustraliaAustriaAzerbaijanBahrainBangladeshBelarusBelgiumBeninBoliviaBosnia and HerzegovinaBotswanaBrazilBrunei DarussalamBulgariaCambodiaCameroonCanadaCentral Europe and the BalticsChileChinaColombiaCongo, Dem. Rep.Congo, Rep.Costa RicaCote d'IvoireCroatiaCubaCuracaoCyprusCzech RepublicDenmarkDominican RepublicEarly-demographic dividendEast Asia & PacificEast Asia & Pacific (excluding high income)East Asia & Pacific (IDA & IBRD countries)EcuadorEgypt, Arab Rep.El SalvadorEritreaEstoniaEthiopiaEuro areaEurope & Central AsiaEurope & Central Asia (excluding high income)Europe & Central Asia (IDA & IBRD countries)European UnionFinlandFragile and conflict affected situationsFranceGabonGeorgiaGermanyGhanaGibraltarGreeceGuatemalaHaitiHeavily indebted poor countries (HIPC)High incomeHondurasHong Kong SAR, ChinaHungaryIBRD onlyIcelandIDA & IBRD totalIDA blendIDA onlyIDA totalIndiaIndonesiaIran, Islamic Rep.IraqIrelandIsraelItalyJamaicaJapanJordanKazakhstanKenyaKorea, Dem. People’s Rep.Korea, Rep.KosovoKuwaitKyrgyz RepublicLate-demographic dividendLatin America & Caribbean Latin America & Caribbean (excluding high income)Latin America & the Caribbean (IDA & IBRD countries)LatviaLeast developed countries: UN classificationLebanonLibyaLithuaniaLow & middle incomeLower middle incomeLuxembourgMacedonia, FYRMalaysiaMaltaMauritiusMexicoMiddle East & North AfricaMiddle East & North Africa (excluding high income)Middle East & North Africa (IDA & IBRD countries)Middle incomeMoldovaMongoliaMontenegroMoroccoMozambiqueMyanmarNamibiaNepalNetherlandsNew ZealandNicaraguaNigerNigeriaNorth AmericaNorwayOECD membersOmanOther small statesPakistanPanamaParaguayPeruPhilippinesPolandPortugalPost-demographic dividendPre-demographic dividendQatarRomaniaRussian FederationSaudi ArabiaSenegalSerbiaSingaporeSlovak RepublicSloveniaSmall statesSouth AfricaSouth AsiaSouth Asia (IDA & IBRD)South SudanSpainSri LankaSub-Saharan Africa Sub-Saharan Africa (excluding high income)Sub-Saharan Africa (IDA & IBRD countries)SudanSwedenSwitzerlandSyrian Arab RepublicTajikistanTanzaniaThailandTogoTrinidad and TobagoTunisiaTurkeyTurkmenistanUkraineUnited Arab EmiratesUnited KingdomUnited StatesUpper middle incomeUruguayUzbekistanVenezuela, RBVietnamWorldYemen, Rep.ZambiaZimbabwe Timeline:
This timeline shows a graph from 1972 to 2014 of Myanmar. No data until 1971. Number of actual observations by date: 43.
Source name:
World Development Indicators
Source organization:
IEA Statistics © OECD/IEA 2014 (http://www.iea.org/stats/index.asp), subject to https://www.iea.org/t&c/termsandconditions/
Categories, topics:
Energy & Mining, Climate Change, Infrastructure
Last updated:
apr 23, 2017
Indicators value changes by year
Minimum:
22.376
jan 1, 2000
Maximum:
76.186
jan 1, 2012
At the date of observation
Value
Absolute change
Change from previous value
jan 1, 1972
69.03
+69.03
0.0%
jan 1, 1973
71.56
+2.529
3.66%
jan 1, 1974
70.158
-1.401
-1.96%
jan 1, 1975
67.139
-3.019
-4.3%
jan 1, 1976
57.975
-9.164
-13.65%
jan 1, 1977
58.516
+0.541
0.93%
jan 1, 1978
60.202
+1.685
2.88%
jan 1, 1979
59.212
-0.99
-1.64%
jan 1, 1980
57.463
-1.749
-2.95%
jan 1, 1981
53.531
-3.932
-6.84%
jan 1, 1982
61.649
+8.118
15.17%
jan 1, 1983
59.729
-1.919
-3.11%
jan 1, 1984
59.284
-0.446
-0.75%
jan 1, 1985
53.492
-5.792
-9.77%
jan 1, 1986
47.334
-6.158
-11.51%
jan 1, 1987
46.414
-0.919
-1.94%
jan 1, 1988
44.138
-2.276
-4.9%
jan 1, 1989
42.004
-2.134
-4.84%
jan 1, 1990
49.719
+7.716
18.37%
jan 1, 1991
48.144
-1.576
-3.17%
jan 1, 1992
46.321
-1.823
-3.79%
jan 1, 1993
50.668
+4.347
9.38%
jan 1, 1994
50.369
-0.298
-0.59%
jan 1, 1995
44.908
-5.461
-10.84%
jan 1, 1996
40.049
-4.859
-10.82%
jan 1, 1997
41.85
+1.801
4.5%
jan 1, 1998
37.93
-3.92
-9.37%
jan 1, 1999
22.928
-15.002
-39.55%
jan 1, 2000
22.376
-0.553
-2.41%
jan 1, 2001
36.968
+14.592
65.21%
jan 1, 2002
38.857
+1.889
5.11%
jan 1, 2003
41.654
+2.797
7.2%
jan 1, 2004
38.249
-3.405
-8.17%
jan 1, 2005
42.931
+4.682
12.24%
jan 1, 2006
49.817
+6.886
16.04%
jan 1, 2007
53.942
+4.125
8.28%
jan 1, 2008
56.556
+2.613
4.84%
jan 1, 2009
61.477
+4.921
8.7%
jan 1, 2010
75.474
+13.997
22.77%
jan 1, 2011
67.679
-7.795
-10.33%
jan 1, 2012
76.186
+8.507
12.57%
jan 1, 2013
72.363
-3.823
-5.02%
jan 1, 2014
74.668
+2.305
3.18%
Ranking of countries by current statistics by years


Comments: