29
/
en
AIzaSyAYiBZKx7MnpbEhh9jyipgxe19OcubqV5w
April 1, 2024
56152
Small states
SST
false
2
1
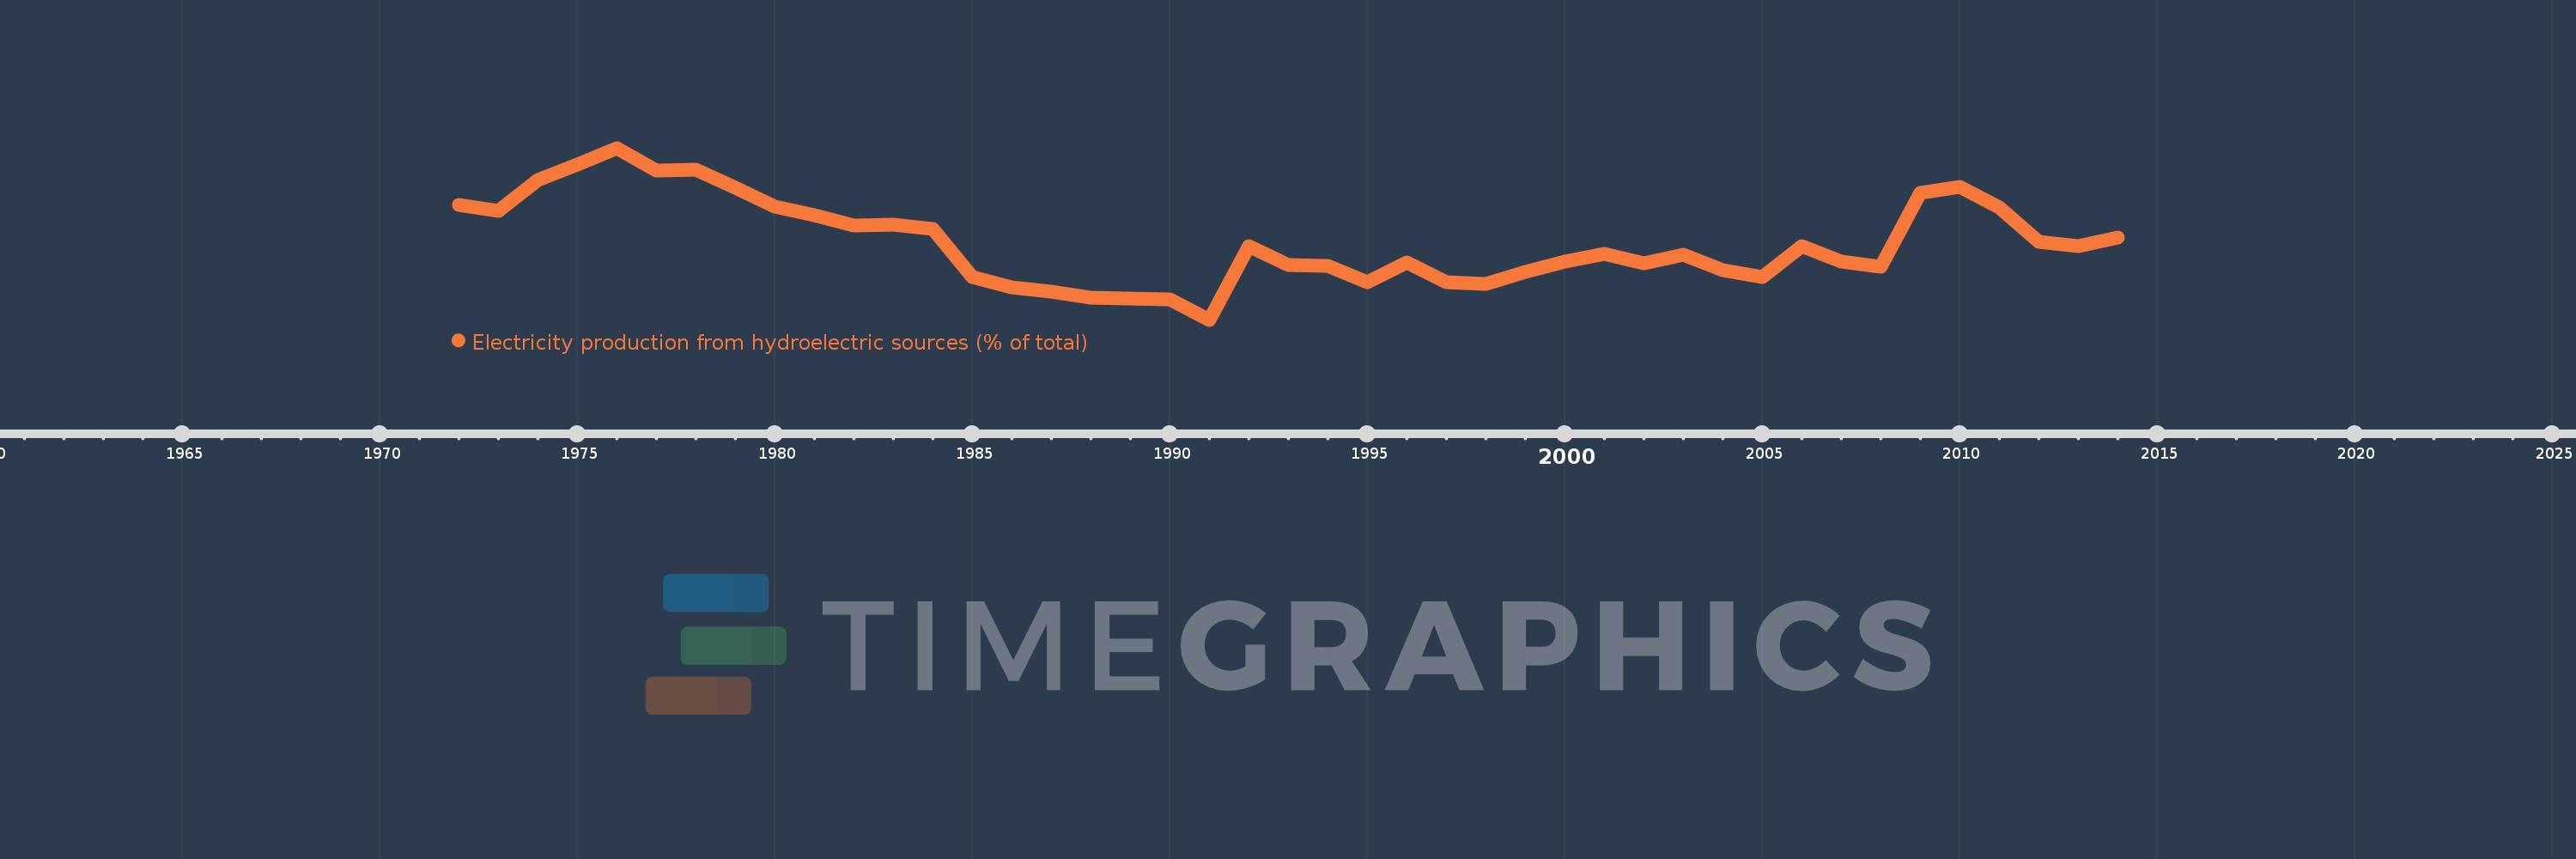
Electricity production from hydroelectric sources (% of total)
2014,2013,2012,2011,2010,2009,2008,2007,2006,2005,2004,2003,2002,2001,2000,1999,1998,1997,1996,1995,1994,1993,1992,1991,1990,1989,1988,1987,1986,1985,1984,1983,1982,1981,1980,1979,1978,1977,1976,1975,1974,1973,1972
This statistics in other country:
AlbaniaAlgeriaAngolaArab WorldArgentinaArmeniaAustraliaAustriaAzerbaijanBahrainBangladeshBelarusBelgiumBeninBoliviaBosnia and HerzegovinaBotswanaBrazilBrunei DarussalamBulgariaCambodiaCameroonCanadaCentral Europe and the BalticsChileChinaColombiaCongo, Dem. Rep.Congo, Rep.Costa RicaCote d'IvoireCroatiaCubaCuracaoCyprusCzech RepublicDenmarkDominican RepublicEarly-demographic dividendEast Asia & PacificEast Asia & Pacific (excluding high income)East Asia & Pacific (IDA & IBRD countries)EcuadorEgypt, Arab Rep.El SalvadorEritreaEstoniaEthiopiaEuro areaEurope & Central AsiaEurope & Central Asia (excluding high income)Europe & Central Asia (IDA & IBRD countries)European UnionFinlandFragile and conflict affected situationsFranceGabonGeorgiaGermanyGhanaGibraltarGreeceGuatemalaHaitiHeavily indebted poor countries (HIPC)High incomeHondurasHong Kong SAR, ChinaHungaryIBRD onlyIcelandIDA & IBRD totalIDA blendIDA onlyIDA totalIndiaIndonesiaIran, Islamic Rep.IraqIrelandIsraelItalyJamaicaJapanJordanKazakhstanKenyaKorea, Dem. People’s Rep.Korea, Rep.KosovoKuwaitKyrgyz RepublicLate-demographic dividendLatin America & Caribbean Latin America & Caribbean (excluding high income)Latin America & the Caribbean (IDA & IBRD countries)LatviaLeast developed countries: UN classificationLebanonLibyaLithuaniaLow & middle incomeLower middle incomeLuxembourgMacedonia, FYRMalaysiaMaltaMauritiusMexicoMiddle East & North AfricaMiddle East & North Africa (excluding high income)Middle East & North Africa (IDA & IBRD countries)Middle incomeMoldovaMongoliaMontenegroMoroccoMozambiqueMyanmarNamibiaNepalNetherlandsNew ZealandNicaraguaNigerNigeriaNorth AmericaNorwayOECD membersOmanOther small statesPakistanPanamaParaguayPeruPhilippinesPolandPortugalPost-demographic dividendPre-demographic dividendQatarRomaniaRussian FederationSaudi ArabiaSenegalSerbiaSingaporeSlovak RepublicSloveniaSmall statesSouth AfricaSouth AsiaSouth Asia (IDA & IBRD)South SudanSpainSri LankaSub-Saharan Africa Sub-Saharan Africa (excluding high income)Sub-Saharan Africa (IDA & IBRD countries)SudanSwedenSwitzerlandSyrian Arab RepublicTajikistanTanzaniaThailandTogoTrinidad and TobagoTunisiaTurkeyTurkmenistanUkraineUnited Arab EmiratesUnited KingdomUnited StatesUpper middle incomeUruguayUzbekistanVenezuela, RBVietnamWorldYemen, Rep.ZambiaZimbabwe Timeline:
This timeline shows a graph from 1972 to 2014 of Small states. No data until 1971. Number of actual observations by date: 43.
Source name:
World Development Indicators
Source organization:
IEA Statistics © OECD/IEA 2014 (http://www.iea.org/stats/index.asp), subject to https://www.iea.org/t&c/termsandconditions/
Categories, topics:
Energy & Mining, Climate Change, Infrastructure
Last updated:
apr 23, 2017
Indicators value changes by year
Maximum:
15.189
jan 1, 1976
At the date of observation
Value
Absolute change
Change from previous value
jan 1, 1972
12.951
+12.951
0.0%
jan 1, 1973
12.722
-0.229
-1.76%
jan 1, 1974
13.932
+1.21
9.51%
jan 1, 1975
14.538
+0.606
4.35%
jan 1, 1976
15.189
+0.651
4.48%
jan 1, 1977
14.308
-0.881
-5.8%
jan 1, 1978
14.329
+0.022
0.15%
jan 1, 1979
13.616
-0.714
-4.98%
jan 1, 1980
12.906
-0.71
-5.22%
jan 1, 1981
12.546
-0.359
-2.78%
jan 1, 1982
12.145
-0.402
-3.2%
jan 1, 1983
12.169
+0.025
0.2%
jan 1, 1984
12.007
-0.162
-1.33%
jan 1, 1985
10.143
-1.863
-15.52%
jan 1, 1986
9.73
-0.413
-4.07%
jan 1, 1987
9.548
-0.182
-1.87%
jan 1, 1988
9.327
-0.221
-2.31%
jan 1, 1989
9.287
-0.04
-0.43%
jan 1, 1990
9.248
-0.039
-0.42%
jan 1, 1991
8.461
-0.787
-8.51%
jan 1, 1992
11.355
+2.895
34.21%
jan 1, 1993
10.609
-0.747
-6.58%
jan 1, 1994
10.57
-0.038
-0.36%
jan 1, 1995
9.944
-0.627
-5.93%
jan 1, 1996
10.704
+0.761
7.65%
jan 1, 1997
9.936
-0.768
-7.17%
jan 1, 1998
9.859
-0.077
-0.78%
jan 1, 1999
10.327
+0.468
4.75%
jan 1, 2000
10.75
+0.423
4.1%
jan 1, 2001
11.037
+0.287
2.67%
jan 1, 2002
10.683
-0.355
-3.21%
jan 1, 2003
11.02
+0.338
3.16%
jan 1, 2004
10.411
-0.609
-5.52%
jan 1, 2005
10.137
-0.274
-2.63%
jan 1, 2006
11.343
+1.206
11.89%
jan 1, 2007
10.738
-0.605
-5.33%
jan 1, 2008
10.523
-0.215
-2.01%
jan 1, 2009
13.436
+2.913
27.68%
jan 1, 2010
13.654
+0.218
1.62%
jan 1, 2011
12.85
-0.804
-5.89%
jan 1, 2012
11.511
-1.339
-10.42%
jan 1, 2013
11.356
-0.155
-1.35%
jan 1, 2014
11.697
+0.342
3.01%
Ranking of countries by current statistics by years


Comments: