29
/
en
AIzaSyAYiBZKx7MnpbEhh9jyipgxe19OcubqV5w
April 1, 2024
36487
IBRD only
IBD
false
2
1
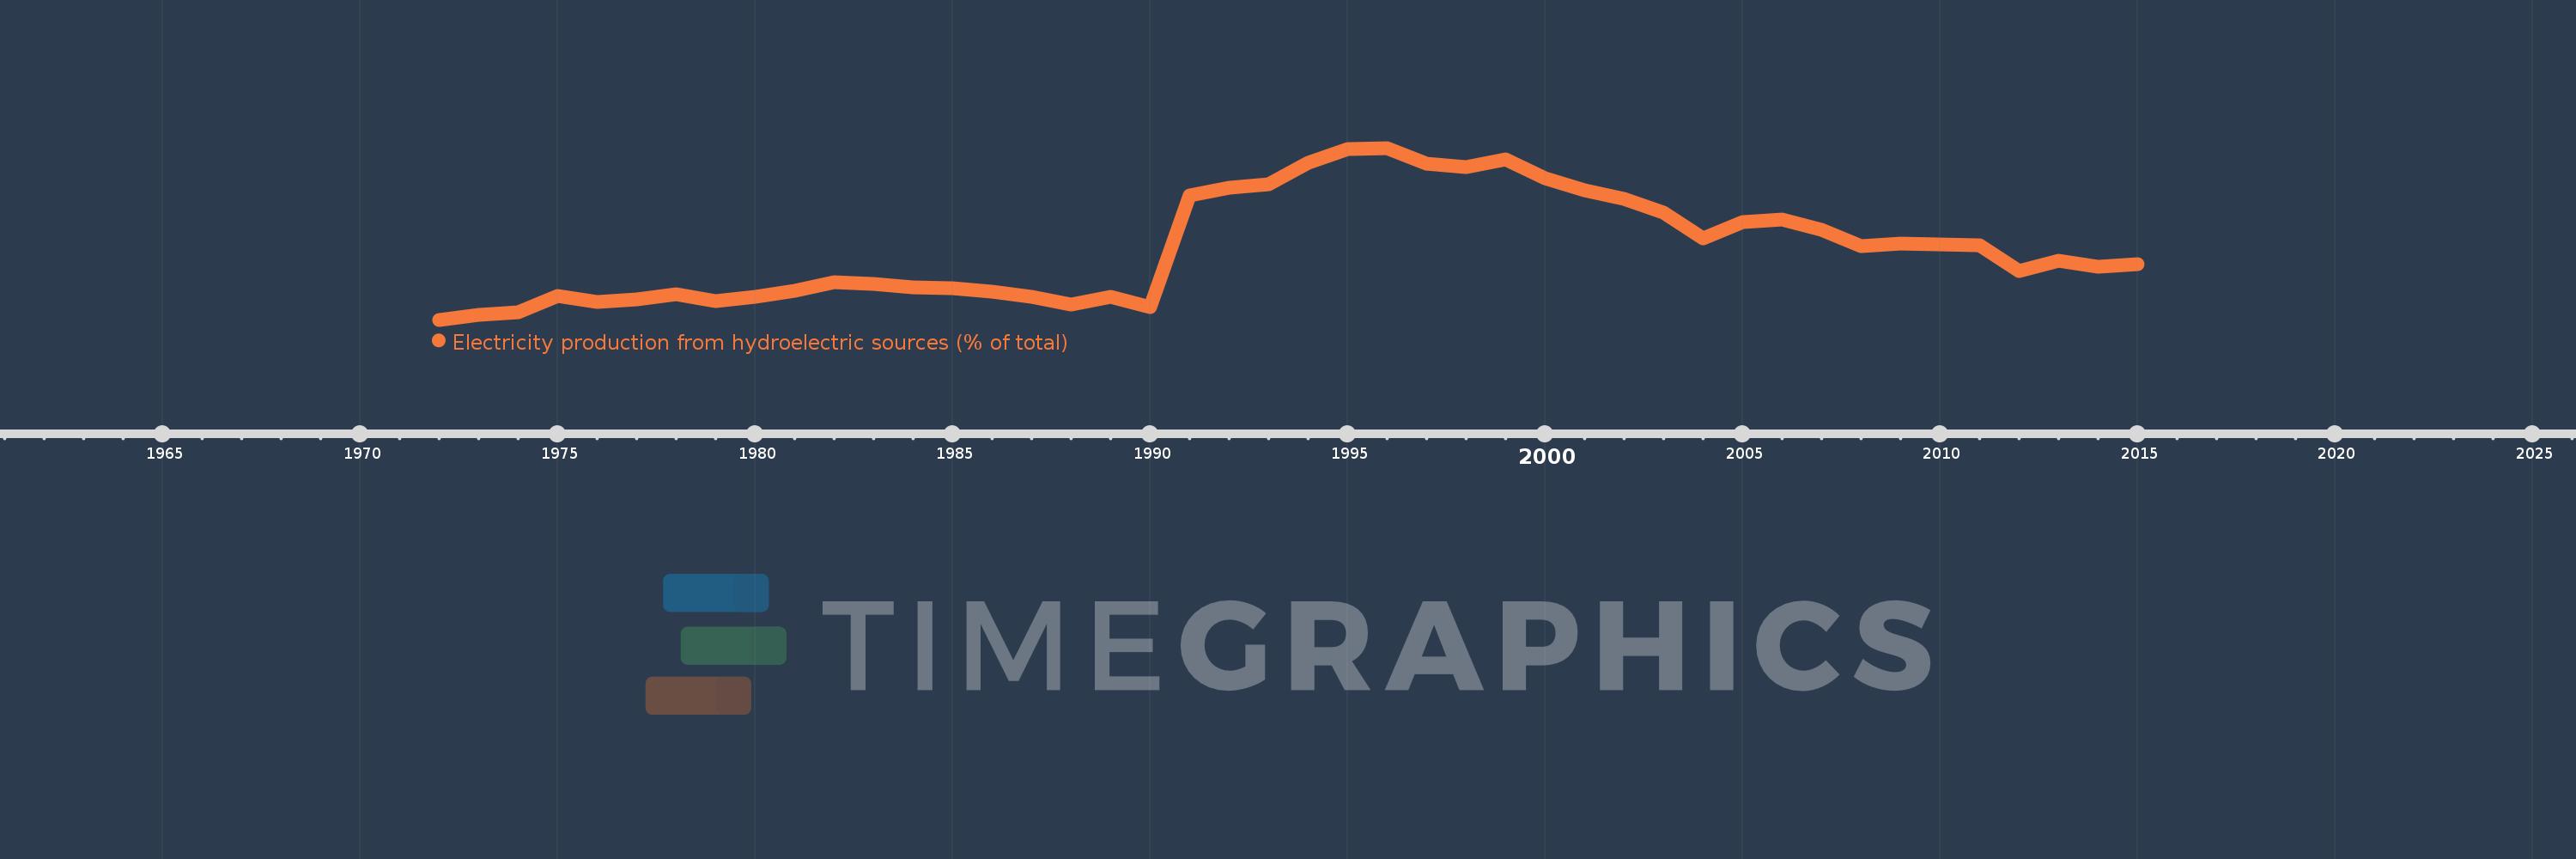
Electricity production from hydroelectric sources (% of total)
2015,2014,2013,2012,2011,2010,2009,2008,2007,2006,2005,2004,2003,2002,2001,2000,1999,1998,1997,1996,1995,1994,1993,1992,1991,1990,1989,1988,1987,1986,1985,1984,1983,1982,1981,1980,1979,1978,1977,1976,1975,1974,1973,1972
This statistics in other country:
AlbaniaAlgeriaAngolaArab WorldArgentinaArmeniaAustraliaAustriaAzerbaijanBahrainBangladeshBelarusBelgiumBeninBoliviaBosnia and HerzegovinaBotswanaBrazilBrunei DarussalamBulgariaCambodiaCameroonCanadaCentral Europe and the BalticsChileChinaColombiaCongo, Dem. Rep.Congo, Rep.Costa RicaCote d'IvoireCroatiaCubaCuracaoCyprusCzech RepublicDenmarkDominican RepublicEarly-demographic dividendEast Asia & PacificEast Asia & Pacific (excluding high income)East Asia & Pacific (IDA & IBRD countries)EcuadorEgypt, Arab Rep.El SalvadorEritreaEstoniaEthiopiaEuro areaEurope & Central AsiaEurope & Central Asia (excluding high income)Europe & Central Asia (IDA & IBRD countries)European UnionFinlandFragile and conflict affected situationsFranceGabonGeorgiaGermanyGhanaGibraltarGreeceGuatemalaHaitiHeavily indebted poor countries (HIPC)High incomeHondurasHong Kong SAR, ChinaHungaryIBRD onlyIcelandIDA & IBRD totalIDA blendIDA onlyIDA totalIndiaIndonesiaIran, Islamic Rep.IraqIrelandIsraelItalyJamaicaJapanJordanKazakhstanKenyaKorea, Dem. People’s Rep.Korea, Rep.KosovoKuwaitKyrgyz RepublicLate-demographic dividendLatin America & Caribbean Latin America & Caribbean (excluding high income)Latin America & the Caribbean (IDA & IBRD countries)LatviaLeast developed countries: UN classificationLebanonLibyaLithuaniaLow & middle incomeLower middle incomeLuxembourgMacedonia, FYRMalaysiaMaltaMauritiusMexicoMiddle East & North AfricaMiddle East & North Africa (excluding high income)Middle East & North Africa (IDA & IBRD countries)Middle incomeMoldovaMongoliaMontenegroMoroccoMozambiqueMyanmarNamibiaNepalNetherlandsNew ZealandNicaraguaNigerNigeriaNorth AmericaNorwayOECD membersOmanOther small statesPakistanPanamaParaguayPeruPhilippinesPolandPortugalPost-demographic dividendPre-demographic dividendQatarRomaniaRussian FederationSaudi ArabiaSenegalSerbiaSingaporeSlovak RepublicSloveniaSmall statesSouth AfricaSouth AsiaSouth Asia (IDA & IBRD)South SudanSpainSri LankaSub-Saharan Africa Sub-Saharan Africa (excluding high income)Sub-Saharan Africa (IDA & IBRD countries)SudanSwedenSwitzerlandSyrian Arab RepublicTajikistanTanzaniaThailandTogoTrinidad and TobagoTunisiaTurkeyTurkmenistanUkraineUnited Arab EmiratesUnited KingdomUnited StatesUpper middle incomeUruguayUzbekistanVenezuela, RBVietnamWorldYemen, Rep.ZambiaZimbabwe Timeline:
This timeline shows a graph from 1972 to 2015 of IBRD only. No data until 1971. Number of actual observations by date: 44.
Source name:
World Development Indicators
Source organization:
IEA Statistics © OECD/IEA 2014 (http://www.iea.org/stats/index.asp), subject to https://www.iea.org/t&c/termsandconditions/
Categories, topics:
Energy & Mining, Climate Change, Infrastructure
Last updated:
apr 23, 2017
Indicators value changes by year
Minimum:
16.242
jan 1, 1972
Maximum:
24.751
jan 1, 1996
At the date of observation
Value
Absolute change
Change from previous value
jan 1, 1972
16.242
+16.242
0.0%
jan 1, 1973
16.485
+0.242
1.49%
jan 1, 1974
16.626
+0.141
0.86%
jan 1, 1975
17.408
+0.782
4.7%
jan 1, 1976
17.124
-0.283
-1.63%
jan 1, 1977
17.252
+0.128
0.75%
jan 1, 1978
17.507
+0.255
1.48%
jan 1, 1979
17.16
-0.347
-1.98%
jan 1, 1980
17.391
+0.231
1.35%
jan 1, 1981
17.673
+0.281
1.62%
jan 1, 1982
18.1
+0.428
2.42%
jan 1, 1983
18.0
-0.1
-0.55%
jan 1, 1984
17.846
-0.154
-0.86%
jan 1, 1985
17.821
-0.025
-0.14%
jan 1, 1986
17.648
-0.172
-0.97%
jan 1, 1987
17.362
-0.286
-1.62%
jan 1, 1988
16.975
-0.387
-2.23%
jan 1, 1989
17.363
+0.387
2.28%
jan 1, 1990
16.862
-0.501
-2.89%
jan 1, 1991
22.407
+5.545
32.88%
jan 1, 1992
22.778
+0.372
1.66%
jan 1, 1993
22.956
+0.178
0.78%
jan 1, 1994
24.007
+1.051
4.58%
jan 1, 1995
24.713
+0.706
2.94%
jan 1, 1996
24.751
+0.038
0.16%
jan 1, 1997
23.958
-0.793
-3.2%
jan 1, 1998
23.808
-0.15
-0.63%
jan 1, 1999
24.184
+0.376
1.58%
jan 1, 2000
23.261
-0.923
-3.82%
jan 1, 2001
22.633
-0.628
-2.7%
jan 1, 2002
22.217
-0.416
-1.84%
jan 1, 2003
21.554
-0.663
-2.99%
jan 1, 2004
20.277
-1.277
-5.93%
jan 1, 2005
21.068
+0.792
3.9%
jan 1, 2006
21.189
+0.12
0.57%
jan 1, 2007
20.69
-0.498
-2.35%
jan 1, 2008
19.867
-0.823
-3.98%
jan 1, 2009
20.019
+0.152
0.76%
jan 1, 2010
19.982
-0.038
-0.19%
jan 1, 2011
19.924
-0.057
-0.29%
jan 1, 2012
18.671
-1.253
-6.29%
jan 1, 2013
19.163
+0.492
2.64%
jan 1, 2014
18.883
-0.281
-1.46%
jan 1, 2015
19.014
+0.131
0.69%
Ranking of countries by current statistics by years


Comments: