29
/
en
AIzaSyAYiBZKx7MnpbEhh9jyipgxe19OcubqV5w
April 1, 2024
245461
South Africa
ZAF
true
2
1
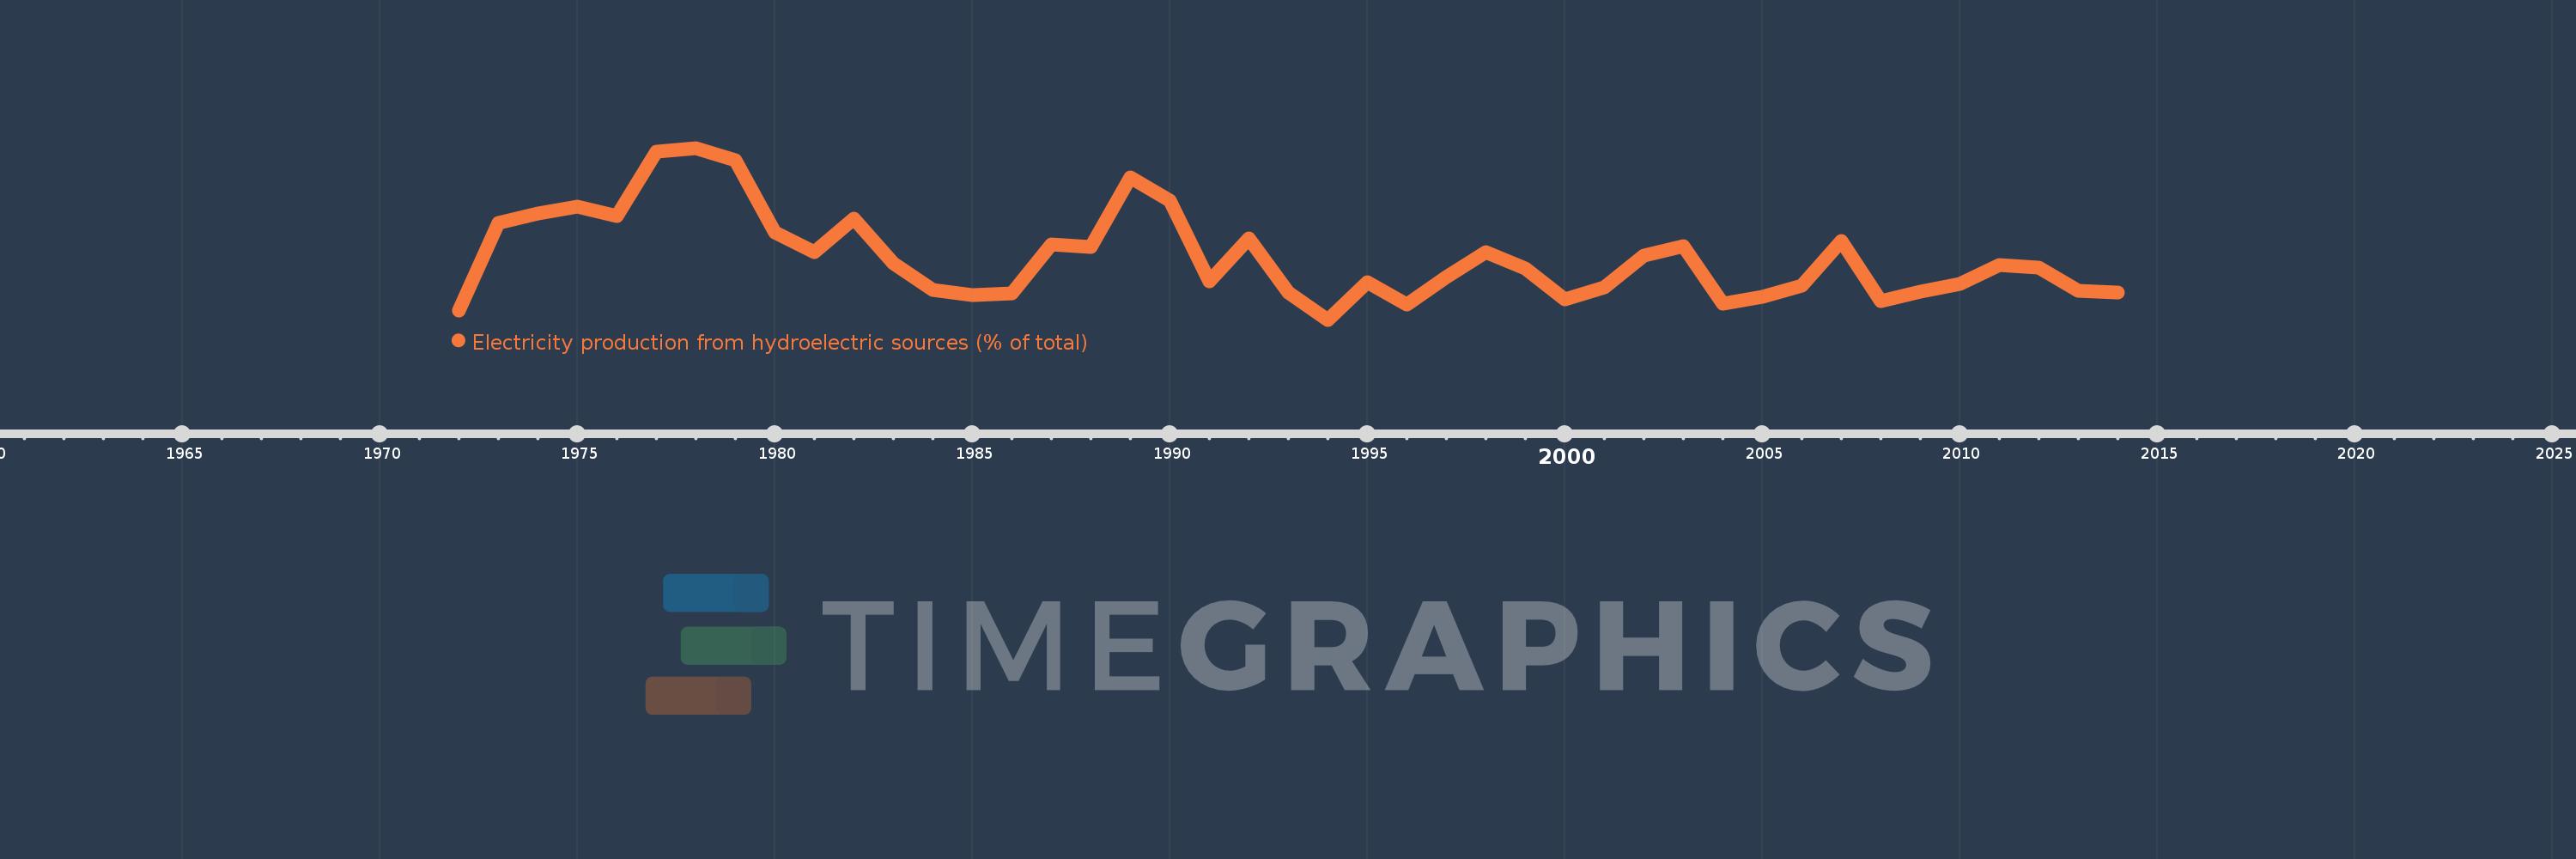
Electricity production from hydroelectric sources (% of total)
2014,2013,2012,2011,2010,2009,2008,2007,2006,2005,2004,2003,2002,2001,2000,1999,1998,1997,1996,1995,1994,1993,1992,1991,1990,1989,1988,1987,1986,1985,1984,1983,1982,1981,1980,1979,1978,1977,1976,1975,1974,1973,1972
This statistics in other country:
AlbaniaAlgeriaAngolaArab WorldArgentinaArmeniaAustraliaAustriaAzerbaijanBahrainBangladeshBelarusBelgiumBeninBoliviaBosnia and HerzegovinaBotswanaBrazilBrunei DarussalamBulgariaCambodiaCameroonCanadaCentral Europe and the BalticsChileChinaColombiaCongo, Dem. Rep.Congo, Rep.Costa RicaCote d'IvoireCroatiaCubaCuracaoCyprusCzech RepublicDenmarkDominican RepublicEarly-demographic dividendEast Asia & PacificEast Asia & Pacific (excluding high income)East Asia & Pacific (IDA & IBRD countries)EcuadorEgypt, Arab Rep.El SalvadorEritreaEstoniaEthiopiaEuro areaEurope & Central AsiaEurope & Central Asia (excluding high income)Europe & Central Asia (IDA & IBRD countries)European UnionFinlandFragile and conflict affected situationsFranceGabonGeorgiaGermanyGhanaGibraltarGreeceGuatemalaHaitiHeavily indebted poor countries (HIPC)High incomeHondurasHong Kong SAR, ChinaHungaryIBRD onlyIcelandIDA & IBRD totalIDA blendIDA onlyIDA totalIndiaIndonesiaIran, Islamic Rep.IraqIrelandIsraelItalyJamaicaJapanJordanKazakhstanKenyaKorea, Dem. People’s Rep.Korea, Rep.KosovoKuwaitKyrgyz RepublicLate-demographic dividendLatin America & Caribbean Latin America & Caribbean (excluding high income)Latin America & the Caribbean (IDA & IBRD countries)LatviaLeast developed countries: UN classificationLebanonLibyaLithuaniaLow & middle incomeLower middle incomeLuxembourgMacedonia, FYRMalaysiaMaltaMauritiusMexicoMiddle East & North AfricaMiddle East & North Africa (excluding high income)Middle East & North Africa (IDA & IBRD countries)Middle incomeMoldovaMongoliaMontenegroMoroccoMozambiqueMyanmarNamibiaNepalNetherlandsNew ZealandNicaraguaNigerNigeriaNorth AmericaNorwayOECD membersOmanOther small statesPakistanPanamaParaguayPeruPhilippinesPolandPortugalPost-demographic dividendPre-demographic dividendQatarRomaniaRussian FederationSaudi ArabiaSenegalSerbiaSingaporeSlovak RepublicSloveniaSmall statesSouth AfricaSouth AsiaSouth Asia (IDA & IBRD)South SudanSpainSri LankaSub-Saharan Africa Sub-Saharan Africa (excluding high income)Sub-Saharan Africa (IDA & IBRD countries)SudanSwedenSwitzerlandSyrian Arab RepublicTajikistanTanzaniaThailandTogoTrinidad and TobagoTunisiaTurkeyTurkmenistanUkraineUnited Arab EmiratesUnited KingdomUnited StatesUpper middle incomeUruguayUzbekistanVenezuela, RBVietnamWorldYemen, Rep.ZambiaZimbabwe Timeline:
This timeline shows a graph from 1972 to 2014 of South Africa. No data until 1971. Number of actual observations by date: 43.
Source name:
World Development Indicators
Source organization:
IEA Statistics © OECD/IEA 2014 (http://www.iea.org/stats/index.asp), subject to https://www.iea.org/t&c/termsandconditions/
Categories, topics:
Energy & Mining, Climate Change, Infrastructure
Last updated:
apr 23, 2017
Indicators value changes by year
At the date of observation
Value
Absolute change
Change from previous value
jan 1, 1972
0.205
+0.205
0.0%
jan 1, 1973
1.401
+1.196
583.7%
jan 1, 1974
1.53
+0.128
9.17%
jan 1, 1975
1.625
+0.096
6.26%
jan 1, 1976
1.495
-0.13
-8.0%
jan 1, 1977
2.364
+0.869
58.08%
jan 1, 1978
2.42
+0.056
2.38%
jan 1, 1979
2.257
-0.163
-6.75%
jan 1, 1980
1.275
-0.982
-43.52%
jan 1, 1981
1.003
-0.272
-21.35%
jan 1, 1982
1.454
+0.452
45.07%
jan 1, 1983
0.854
-0.601
-41.3%
jan 1, 1984
0.491
-0.362
-42.46%
jan 1, 1985
0.414
-0.077
-15.72%
jan 1, 1986
0.441
+0.027
6.6%
jan 1, 1987
1.108
+0.667
151.09%
jan 1, 1988
1.074
-0.034
-3.11%
jan 1, 1989
2.017
+0.944
87.89%
jan 1, 1990
1.7
-0.318
-15.75%
jan 1, 1991
0.611
-1.089
-64.07%
jan 1, 1992
1.189
+0.578
94.71%
jan 1, 1993
0.451
-0.738
-62.08%
jan 1, 1994
0.084
-0.367
-81.32%
jan 1, 1995
0.596
+0.512
607.8%
jan 1, 1996
0.285
-0.311
-52.13%
jan 1, 1997
0.661
+0.376
131.7%
jan 1, 1998
1.007
+0.346
52.3%
jan 1, 1999
0.786
-0.221
-21.95%
jan 1, 2000
0.362
-0.424
-53.91%
jan 1, 2001
0.53
+0.168
46.24%
jan 1, 2002
0.954
+0.424
80.0%
jan 1, 2003
1.09
+0.137
14.34%
jan 1, 2004
0.303
-0.787
-72.2%
jan 1, 2005
0.394
+0.091
30.07%
jan 1, 2006
0.55
+0.156
39.56%
jan 1, 2007
1.155
+0.605
109.94%
jan 1, 2008
0.333
-0.822
-71.16%
jan 1, 2009
0.471
+0.138
41.3%
jan 1, 2010
0.567
+0.096
20.48%
jan 1, 2011
0.824
+0.256
45.21%
jan 1, 2012
0.792
-0.031
-3.79%
jan 1, 2013
0.473
-0.32
-40.35%
jan 1, 2014
0.458
-0.015
-3.16%
Ranking of countries by current statistics by years


Comments: