29
/
en
AIzaSyAYiBZKx7MnpbEhh9jyipgxe19OcubqV5w
April 1, 2024
38902
IDA only
IDX
false
2
1
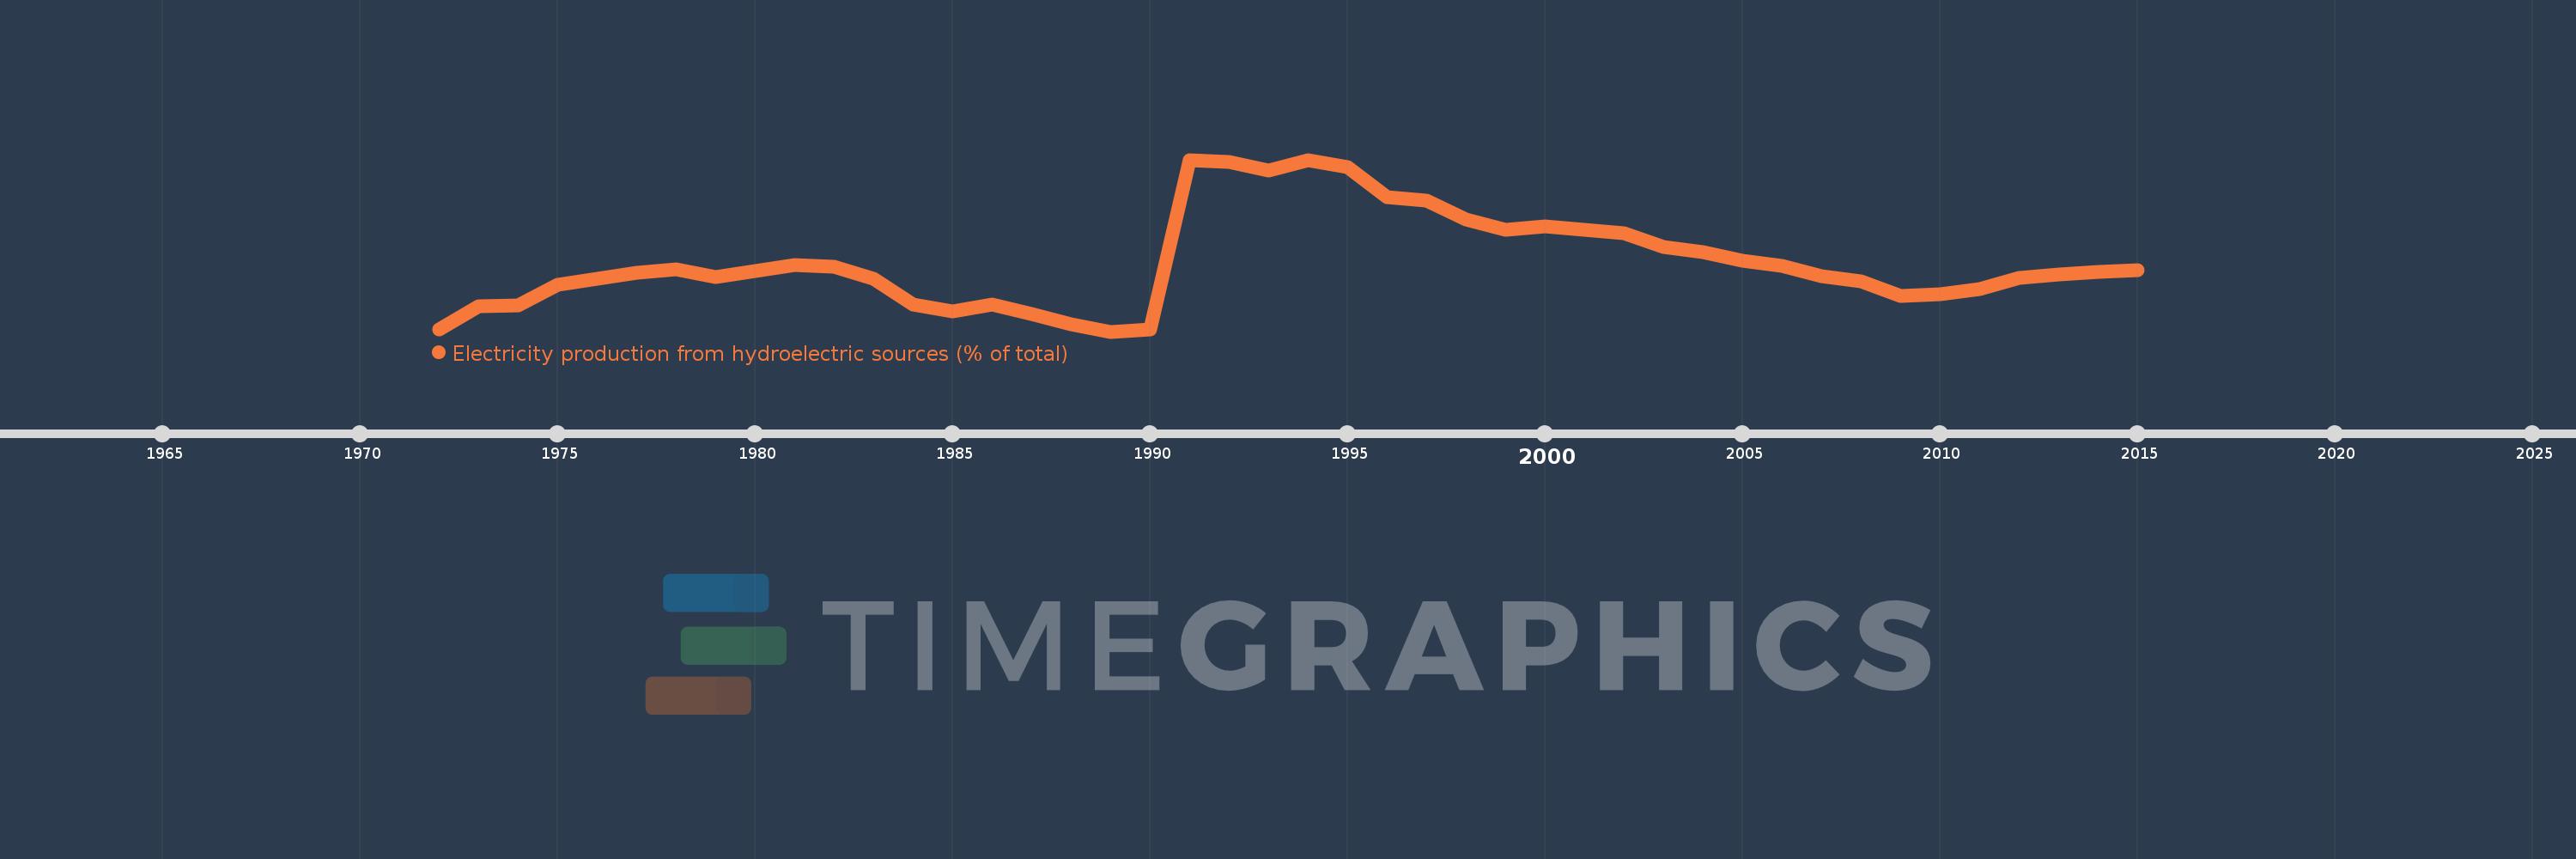
Electricity production from hydroelectric sources (% of total)
2015,2014,2013,2012,2011,2010,2009,2008,2007,2006,2005,2004,2003,2002,2001,2000,1999,1998,1997,1996,1995,1994,1993,1992,1991,1990,1989,1988,1987,1986,1985,1984,1983,1982,1981,1980,1979,1978,1977,1976,1975,1974,1973,1972
This statistics in other country:
AlbaniaAlgeriaAngolaArab WorldArgentinaArmeniaAustraliaAustriaAzerbaijanBahrainBangladeshBelarusBelgiumBeninBoliviaBosnia and HerzegovinaBotswanaBrazilBrunei DarussalamBulgariaCambodiaCameroonCanadaCentral Europe and the BalticsChileChinaColombiaCongo, Dem. Rep.Congo, Rep.Costa RicaCote d'IvoireCroatiaCubaCuracaoCyprusCzech RepublicDenmarkDominican RepublicEarly-demographic dividendEast Asia & PacificEast Asia & Pacific (excluding high income)East Asia & Pacific (IDA & IBRD countries)EcuadorEgypt, Arab Rep.El SalvadorEritreaEstoniaEthiopiaEuro areaEurope & Central AsiaEurope & Central Asia (excluding high income)Europe & Central Asia (IDA & IBRD countries)European UnionFinlandFragile and conflict affected situationsFranceGabonGeorgiaGermanyGhanaGibraltarGreeceGuatemalaHaitiHeavily indebted poor countries (HIPC)High incomeHondurasHong Kong SAR, ChinaHungaryIBRD onlyIcelandIDA & IBRD totalIDA blendIDA onlyIDA totalIndiaIndonesiaIran, Islamic Rep.IraqIrelandIsraelItalyJamaicaJapanJordanKazakhstanKenyaKorea, Dem. People’s Rep.Korea, Rep.KosovoKuwaitKyrgyz RepublicLate-demographic dividendLatin America & Caribbean Latin America & Caribbean (excluding high income)Latin America & the Caribbean (IDA & IBRD countries)LatviaLeast developed countries: UN classificationLebanonLibyaLithuaniaLow & middle incomeLower middle incomeLuxembourgMacedonia, FYRMalaysiaMaltaMauritiusMexicoMiddle East & North AfricaMiddle East & North Africa (excluding high income)Middle East & North Africa (IDA & IBRD countries)Middle incomeMoldovaMongoliaMontenegroMoroccoMozambiqueMyanmarNamibiaNepalNetherlandsNew ZealandNicaraguaNigerNigeriaNorth AmericaNorwayOECD membersOmanOther small statesPakistanPanamaParaguayPeruPhilippinesPolandPortugalPost-demographic dividendPre-demographic dividendQatarRomaniaRussian FederationSaudi ArabiaSenegalSerbiaSingaporeSlovak RepublicSloveniaSmall statesSouth AfricaSouth AsiaSouth Asia (IDA & IBRD)South SudanSpainSri LankaSub-Saharan Africa Sub-Saharan Africa (excluding high income)Sub-Saharan Africa (IDA & IBRD countries)SudanSwedenSwitzerlandSyrian Arab RepublicTajikistanTanzaniaThailandTogoTrinidad and TobagoTunisiaTurkeyTurkmenistanUkraineUnited Arab EmiratesUnited KingdomUnited StatesUpper middle incomeUruguayUzbekistanVenezuela, RBVietnamWorldYemen, Rep.ZambiaZimbabwe Timeline:
This timeline shows a graph from 1972 to 2015 of IDA only. No data until 1971. Number of actual observations by date: 44.
Source name:
World Development Indicators
Source organization:
IEA Statistics © OECD/IEA 2014 (http://www.iea.org/stats/index.asp), subject to https://www.iea.org/t&c/termsandconditions/
Categories, topics:
Energy & Mining, Climate Change, Infrastructure
Last updated:
apr 23, 2017
Indicators value changes by year
Minimum:
31.638
jan 1, 1989
Maximum:
53.997
jan 1, 1994
At the date of observation
Value
Absolute change
Change from previous value
jan 1, 1972
31.923
+31.923
0.0%
jan 1, 1973
34.955
+3.033
9.5%
jan 1, 1974
35.101
+0.146
0.42%
jan 1, 1975
37.781
+2.681
7.64%
jan 1, 1976
38.529
+0.748
1.98%
jan 1, 1977
39.256
+0.727
1.89%
jan 1, 1978
39.763
+0.507
1.29%
jan 1, 1979
38.754
-1.009
-2.54%
jan 1, 1980
39.472
+0.718
1.85%
jan 1, 1981
40.311
+0.84
2.13%
jan 1, 1982
40.096
-0.215
-0.53%
jan 1, 1983
38.538
-1.558
-3.89%
jan 1, 1984
35.171
-3.367
-8.74%
jan 1, 1985
34.318
-0.853
-2.43%
jan 1, 1986
35.2
+0.883
2.57%
jan 1, 1987
33.93
-1.271
-3.61%
jan 1, 1988
32.604
-1.325
-3.91%
jan 1, 1989
31.638
-0.966
-2.96%
jan 1, 1990
31.951
+0.313
0.99%
jan 1, 1991
53.905
+21.954
68.71%
jan 1, 1992
53.668
-0.238
-0.44%
jan 1, 1993
52.637
-1.031
-1.92%
jan 1, 1994
53.997
+1.36
2.58%
jan 1, 1995
53.069
-0.928
-1.72%
jan 1, 1996
49.175
-3.894
-7.34%
jan 1, 1997
48.646
-0.529
-1.08%
jan 1, 1998
46.177
-2.469
-5.07%
jan 1, 1999
44.909
-1.269
-2.75%
jan 1, 2000
45.341
+0.432
0.96%
jan 1, 2001
44.85
-0.491
-1.08%
jan 1, 2002
44.448
-0.403
-0.9%
jan 1, 2003
42.668
-1.78
-4.0%
jan 1, 2004
41.95
-0.718
-1.68%
jan 1, 2005
40.867
-1.083
-2.58%
jan 1, 2006
40.15
-0.718
-1.76%
jan 1, 2007
38.815
-1.335
-3.32%
jan 1, 2008
38.148
-0.667
-1.72%
jan 1, 2009
36.255
-1.893
-4.96%
jan 1, 2010
36.52
+0.266
0.73%
jan 1, 2011
37.185
+0.664
1.82%
jan 1, 2012
38.66
+1.475
3.97%
jan 1, 2013
39.092
+0.432
1.12%
jan 1, 2014
39.444
+0.352
0.9%
jan 1, 2015
39.579
+0.135
0.34%
Ranking of countries by current statistics by years


Comments: