29
/
en
AIzaSyAYiBZKx7MnpbEhh9jyipgxe19OcubqV5w
April 1, 2024
54126
Pacific island small states
PSS
false
2
1
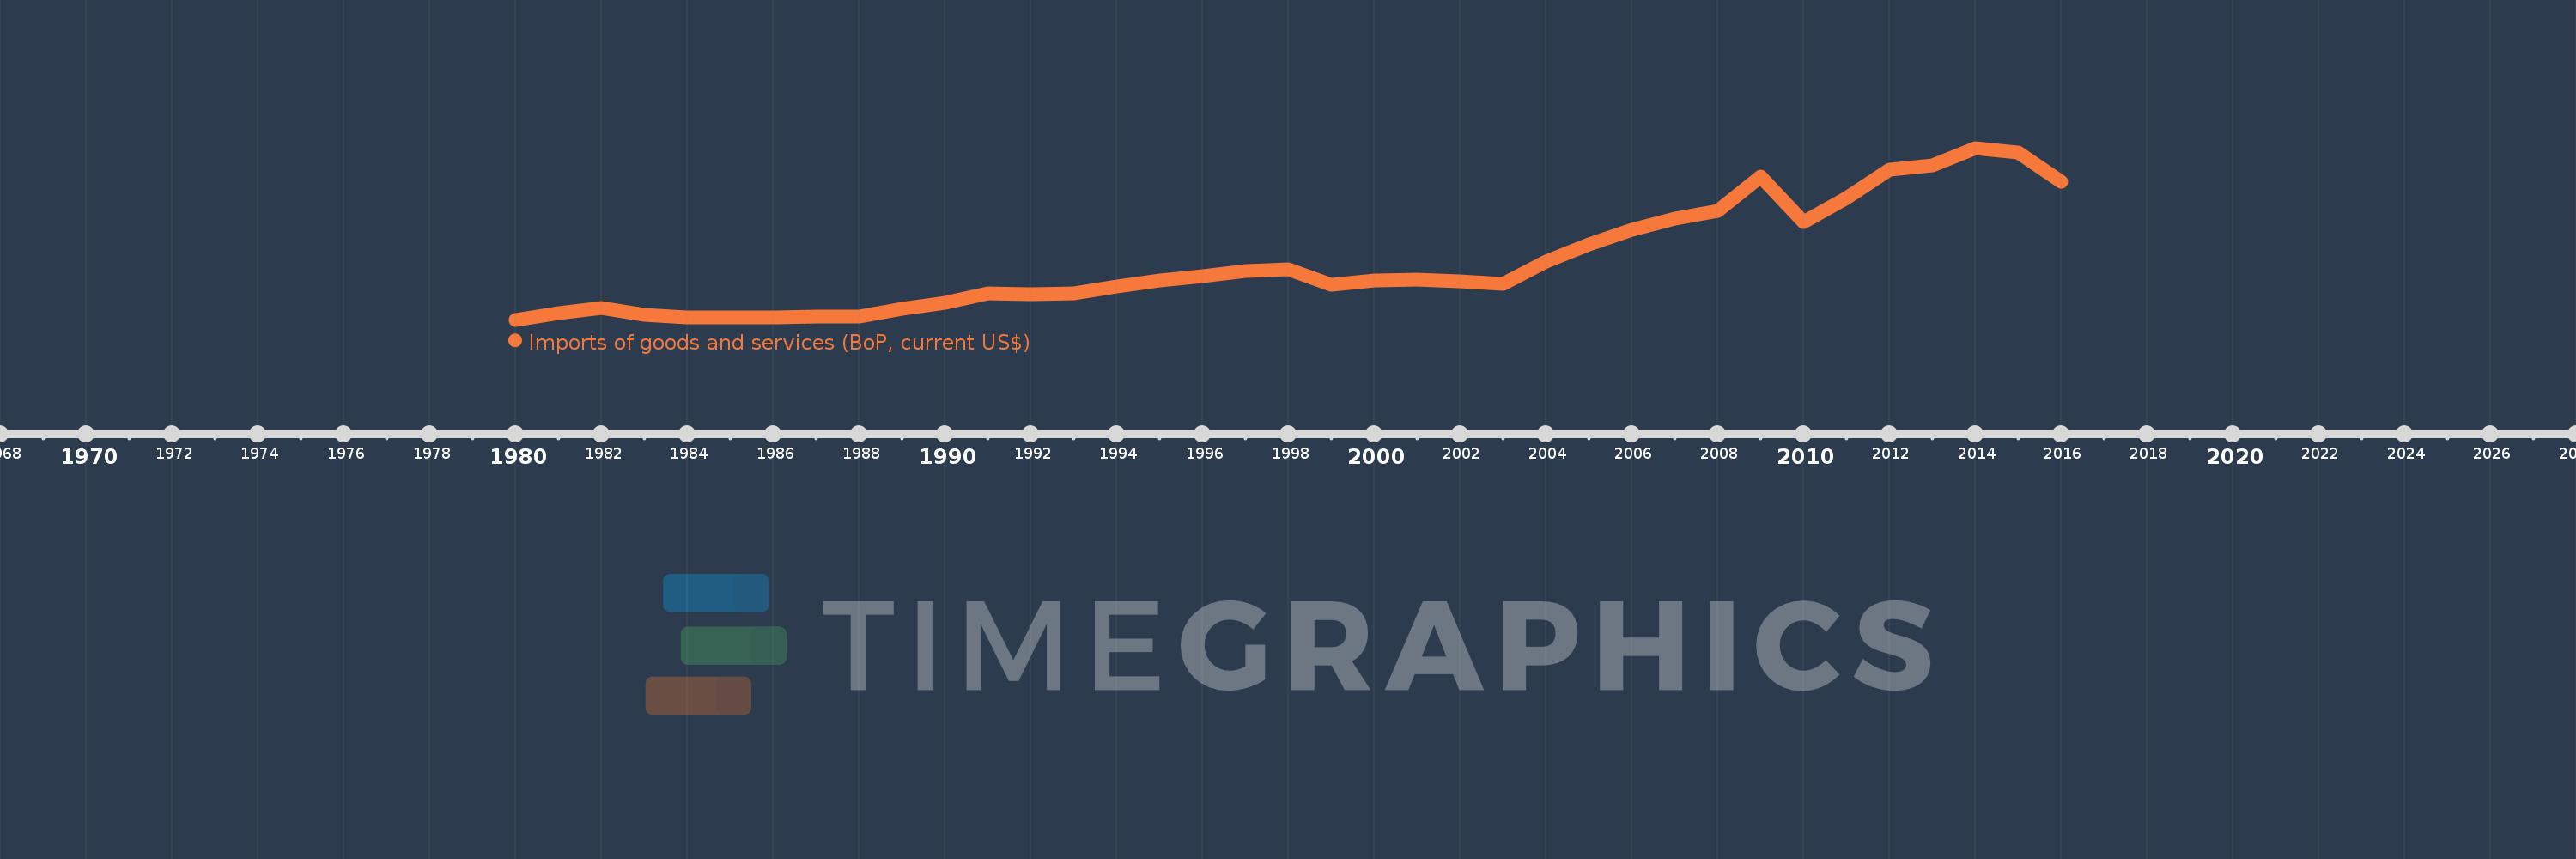
Imports of goods and services (BoP, current US$)
2016,2015,2014,2013,2012,2011,2010,2009,2008,2007,2006,2005,2004,2003,2002,2001,2000,1999,1998,1997,1996,1995,1994,1993,1992,1991,1990,1989,1988,1987,1986,1985,1984,1983,1982,1981,1980
This statistics in other country:
AfghanistanAlbaniaAlgeriaAngolaAntigua and BarbudaArab WorldArgentinaArmeniaArubaAustraliaAustriaAzerbaijanBahamas, TheBahrainBangladeshBarbadosBelarusBelgiumBelizeBeninBermudaBhutanBoliviaBosnia and HerzegovinaBotswanaBrazilBrunei DarussalamBulgariaBurkina FasoBurundiCabo VerdeCambodiaCameroonCanadaCaribbean small statesCentral African RepublicCentral Europe and the BalticsChadChileChinaColombiaComorosCongo, Dem. Rep.Congo, Rep.Costa RicaCote d'IvoireCroatiaCuracaoCyprusCzech RepublicDenmarkDjiboutiDominicaDominican RepublicEarly-demographic dividendEast Asia & PacificEast Asia & Pacific (excluding high income)East Asia & Pacific (IDA & IBRD countries)EcuadorEgypt, Arab Rep.El SalvadorEquatorial GuineaEritreaEstoniaEthiopiaEuro areaEurope & Central AsiaEurope & Central Asia (excluding high income)Europe & Central Asia (IDA & IBRD countries)European UnionFaroe IslandsFijiFinlandFragile and conflict affected situationsFranceFrench PolynesiaGabonGambia, TheGeorgiaGermanyGhanaGreeceGrenadaGuatemalaGuineaGuinea-BissauGuyanaHaitiHeavily indebted poor countries (HIPC)High incomeHondurasHong Kong SAR, ChinaHungaryIBRD onlyIcelandIDA & IBRD totalIDA blendIDA onlyIDA totalIndiaIndonesiaIran, Islamic Rep.IraqIrelandIsraelItalyJamaicaJapanJordanKazakhstanKenyaKiribatiKorea, Rep.KosovoKuwaitKyrgyz RepublicLao PDRLate-demographic dividendLatin America & Caribbean Latin America & Caribbean (excluding high income)Latin America & the Caribbean (IDA & IBRD countries)LatviaLeast developed countries: UN classificationLebanonLesothoLiberiaLibyaLithuaniaLow & middle incomeLow incomeLower middle incomeLuxembourgMacao SAR, ChinaMacedonia, FYRMadagascarMalawiMalaysiaMaldivesMaliMaltaMarshall IslandsMauritaniaMauritiusMexicoMicronesia, Fed. Sts.Middle East & North Africa (excluding high income)Middle East & North Africa (IDA & IBRD countries)Middle incomeMoldovaMongoliaMontenegroMoroccoMozambiqueMyanmarNamibiaNepalNetherlandsNew CaledoniaNicaraguaNigerNigeriaNorth AmericaNorwayOECD membersOmanOther small statesPacific island small statesPakistanPalauPanamaPapua New GuineaParaguayPeruPhilippinesPolandPortugalPost-demographic dividendPre-demographic dividendQatarRomaniaRussian FederationRwandaSamoaSao Tome and PrincipeSaudi ArabiaSenegalSerbiaSeychellesSierra LeoneSingaporeSint Maarten (Dutch part)Slovak RepublicSloveniaSmall statesSolomon IslandsSouth AfricaSouth AsiaSouth Asia (IDA & IBRD)South SudanSpainSri LankaSt. Kitts and NevisSt. LuciaSt. Vincent and the GrenadinesSub-Saharan Africa Sub-Saharan Africa (excluding high income)Sub-Saharan Africa (IDA & IBRD countries)SudanSurinameSwazilandSwedenSwitzerlandSyrian Arab RepublicTajikistanTanzaniaThailandTimor-LesteTogoTongaTrinidad and TobagoTunisiaTurkeyTuvaluUgandaUkraineUnited KingdomUnited StatesUpper middle incomeUruguayVanuatuVenezuela, RBVietnamWest Bank and GazaWorldYemen, Rep.ZambiaZimbabwe Timeline:
This timeline shows a graph from 1980 to 2016 of Pacific island small states. No data until 1979. Number of actual observations by date: 37.
Source name:
World Development Indicators
Source organization:
International Monetary Fund, Balance of Payments Statistics Yearbook and data files.
Categories, topics:
Economy & Growth, Trade
Last updated:
apr 23, 2017
Indicators value changes by year
Minimum:
949.392 mln
jan 1, 1980
Maximum:
5.693 bln
jan 1, 2014
At the date of observation
Value
Absolute change
Change from previous value
jan 1, 1980
949.392 mln
+949.392 mln
0.0%
jan 1, 1981
1.122 bln
+173.039 mln
18.23%
jan 1, 1982
1.273 bln
+150.955 mln
13.45%
jan 1, 1983
1.08 bln
-193.739 mln
-15.21%
jan 1, 1984
1.022 bln
-57.767 mln
-5.35%
jan 1, 1985
1.013 bln
-9.255 mln
-0.91%
jan 1, 1986
1.014 bln
+1.505 mln
0.15%
jan 1, 1987
1.034 bln
+20.143 mln
1.99%
jan 1, 1988
1.037 bln
+2.743 mln
0.27%
jan 1, 1989
1.24 bln
+202.743 mln
19.55%
jan 1, 1990
1.414 bln
+174.242 mln
14.05%
jan 1, 1991
1.678 bln
+263.81 mln
18.66%
jan 1, 1992
1.646 bln
-31.793 mln
-1.89%
jan 1, 1993
1.667 bln
+21.2 mln
1.29%
jan 1, 1994
1.879 bln
+211.314 mln
12.67%
jan 1, 1995
2.037 bln
+158.37 mln
8.43%
jan 1, 1996
2.146 bln
+109.583 mln
5.38%
jan 1, 1997
2.292 bln
+145.401 mln
6.77%
jan 1, 1998
2.345 bln
+52.731 mln
2.3%
jan 1, 1999
1.906 bln
-438.426 mln
-18.7%
jan 1, 2000
2.035 bln
+128.713 mln
6.75%
jan 1, 2001
2.058 bln
+23.485 mln
1.15%
jan 1, 2002
2.009 bln
-49.806 mln
-2.42%
jan 1, 2003
1.945 bln
-63.666 mln
-3.17%
jan 1, 2004
2.551 bln
+605.761 mln
31.15%
jan 1, 2005
3.025 bln
+474.402 mln
18.6%
jan 1, 2006
3.423 bln
+398.158 mln
13.16%
jan 1, 2007
3.744 bln
+321.14 mln
9.38%
jan 1, 2008
3.965 bln
+220.587 mln
5.89%
jan 1, 2009
4.893 bln
+928.035 mln
23.41%
jan 1, 2010
3.635 bln
-1.258 bln
-25.71%
jan 1, 2011
4.314 bln
+679.455 mln
18.69%
jan 1, 2012
5.086 bln
+771.223 mln
17.88%
jan 1, 2013
5.205 bln
+119.122 mln
2.34%
jan 1, 2014
5.693 bln
+488.127 mln
9.38%
jan 1, 2015
5.567 bln
-125.89 mln
-2.21%
jan 1, 2016
4.773 bln
-794.469 mln
-14.27%
Ranking of countries by current statistics by years


Comments: